 Products Home
O-Band Fiber Amplifiers (PDFAs)

- Distortion-Free Amplification
- Integrated Industry-Standard 980 nm Pump Module
- Ripple-Free Gain Spectrum
- Single Mode or Polarization-Maintaining Options
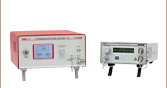
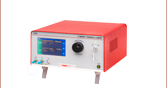
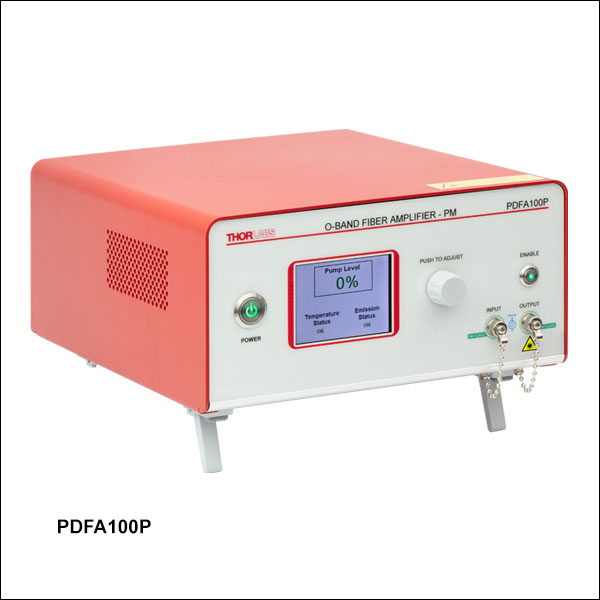
PDFA100P
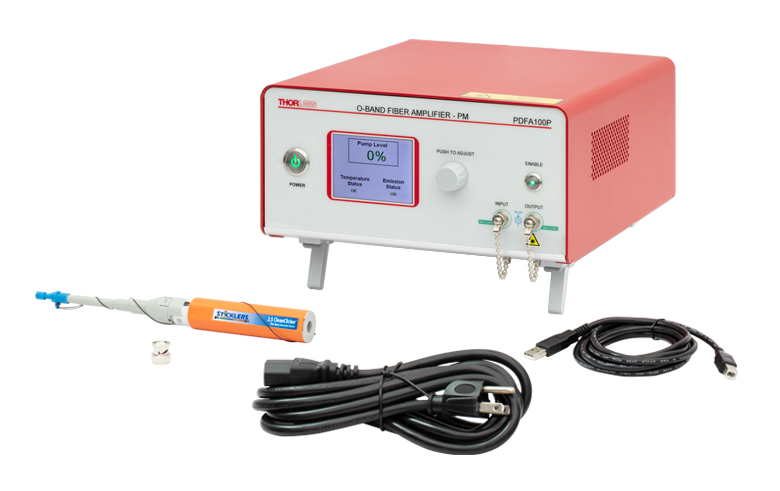
Benchtop Polarization-Maintaining PDFA
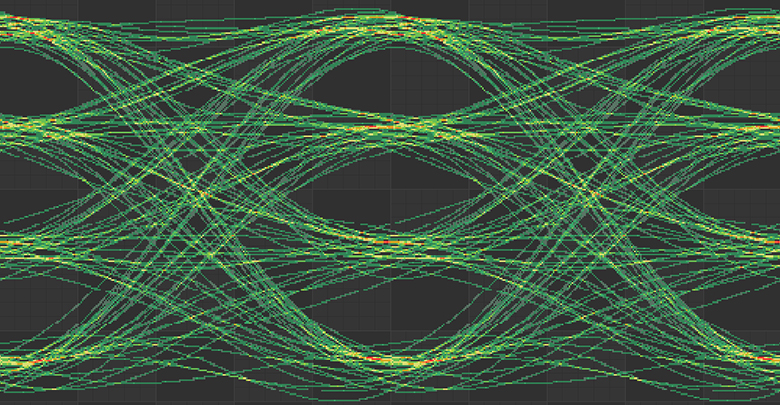
This 50 Gbaud/s PAM4 eye diagram was generated using the PDFA100 system with an input power of -3 dBm and an output power of 10 dBm. See the PDFA vs. SOA tab for details.
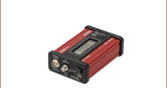
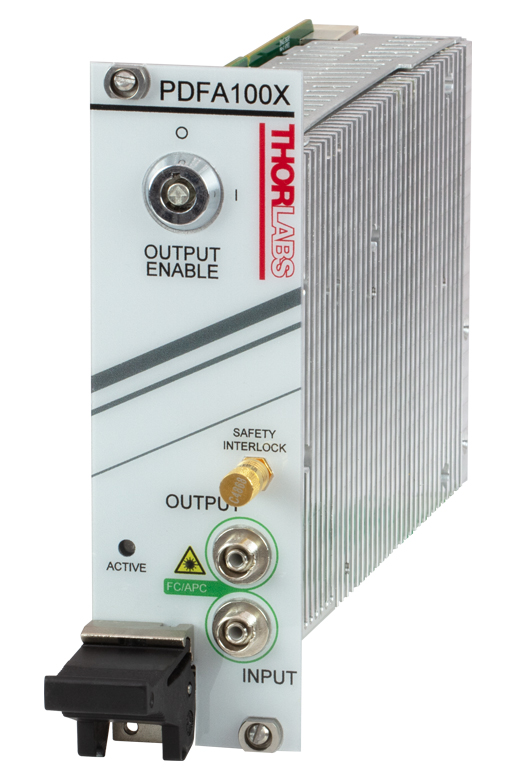
PDFA100X
PXIe Plug-In Module


Please Wait
| Table 1.1 Key System Specificationsa | |||
|---|---|---|---|
| Item # | PDFA100(X) | PDFA100P | |
| Output Powerb (@ 3 dBm Input Power) |
>16 dBm | >15 dBm | |
| Small Signal Gainb (@ -30 dBm Input Power) |
>24 dB | ||
| Noise Figureb (@ -30 dBm Input Power) |
6 dB (Typ.) | 7 dB (Typ.) | |
| Polarization Extinction Ratio | N/A | >20 dB | |
| Polarization-Dependent Gain | <0.5 dB | N/A | |
Click to Enlarge
Figure 1.2 Typical gain spectrum for the PDFA100, PDFA100P, and PDFA100X optical amplifiers. A complete set of performance graphs is available on the Graphs tab.
Click to Enlarge
Figure 1.3 Operating Principle of the PDFA
Features
- Operating Wavelength Range: 1280 - 1330 nm (O-Band)
- Single Mode (SM) or Polarization-Maintaining (PM) Versions (See Table 1.1):
- Available as a Benchtop System (SM or PM) or Plug-In PXIe Module (SM)
- Minimal (<100 ns) Signal Latency
- Operates in Constant Current, Power, or Gain Modes
- Telecom Industry-Standard 980 nm Pump Modules
- No Cross-Gain Modulation, Pattern Dependence, or Modulation Format Dependence
- OEM and Customization Options Available; See the OEM Capabilities Tab or Contact Us for Details
- Optional Gain-Flattening Filter (SM Only) Sold Below
Applications
- 400G and 800G Transceiver Testing
- Overload Testing of O-Band Receivers
- O-Band CWDM Transceiver Testing
- Silicon Photonic Device Characterization in O-Band
- O-Band Signal Transmission for Data Communications
Thorlabs' O-Band Praseodymium-Doped Fiber Amplifiers (PDFAs) offer high output powers, high small signal gain, and low noise figures (see Table 1.1), making them ideal for use within optical networks as either a booster amplifier or preamplifier. The PDFAs are available in single mode (SM) or polarization-maintaining (PM) models. Two form-factors with identical performance are offered for the SM models: a benchtop system (Item # PDFA100) and a plug-in PXIe module (Item # PDFA100X) that is designed to be operated inside a standard PXIe chassis. The PM model is available as a benchtop system (Item # PDFA100P); please contact us for applications requiring a PM PXIe module.
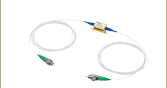
The SM amplifiers are polarization-insensitive, and the input and output fibers to the amplifier are standard single mode fiber (Item # SMF-28-J9). The PDFA100P amplifier is a polarization sensitive benchtop system with input and output isolators that block light polarized along the fast axis; only light that is linearly polarized along the slow axis is amplified. The input and output fibers of the PM amplifier are Fujikura SM13-PS-U25A fiber, and the connector keys are aligned to the slow axis of the fibers. Output light from the PM amplifier has a polarization extinction ratio of >20 dB.
For applications that require PDFAs with custom form factors, power consumption, or optical specifications, please contact us. Thorlabs also offers Ytterbium-Doped Fiber Amplifiers (YDFAs) and Erbium-Doped Fiber Amplifiers (EDFAs), which operate in the 1025 - 1075 nm and 1530 - 1565 nm (C-band) wavelength ranges, respectively.
Operation Modes
The PDFAs can be operated in three modes: automatic current control (ACC), automatic power control (APC), and automatic gain control (AGC). ACC mode drives the pump current in the PDFA at a fixed current level, which is accessible through the front panel of the benchtop units or via a command through the computer connected to the chassis the PXIe module is plugged into. The user can vary the gain and output power level of the instrument by adjusting the pump current level. These O-band fiber amplifiers can also be operated in APC or AGC mode, which maintain fixed output power or fixed gain, respectively. Note that for the PDFA100 and PDFA100P amplifiers, these two operation modes are only accessible through a command-line interface; the units can be connected to a PC via the USB type B port on the back panel of the instruments.
The command line interface can also be used to enable or disable the PDFA100 and PDFA100P amplifiers, set the current level in the ACC mode, or read status indicators. The indicators available through the USB interface include temperature error, interlock status, and emission status. For more details on these features, please refer to the instrument manual.
Fluoride Fiber Amplifier Technology
As Praseodymium (Pr) ions in silica transition to a lower excited state nonradiatively, PDFAs cannot be built using silica fibers. A higher radiative transition efficiency can be obtained by choosing fluoride glass as the host for the Pr ions, and Thorlabs' PDFAs are designed and manufactured using proprietary fluoride fiber to achieve high gain and output power. Please see the PDF Emission tab for more information on light emission in Pr-doped fluoride fibers (PDF). These O-band fiber amplifiers incorporate a relatively short length of PDF, which results in a signal latency <100 ns.
Fiber amplifier technology offers key advantages over semiconductor optical amplifiers (SOAs) when used for boosting communication signals. Distortion effects typically associated with the saturation mechanism and gain dynamics of SOAs do not exist in praseodymium-doped fiber amplifiers (PDFAs), leading to improved compatibility with wavelength division multiplexed systems, advanced modulation formats, and high data rates. In particular, undesirable distortion effects such as cross-gain modulation and pattern dependence are eliminated in the PDFA as a result of its high saturation energy and slow gain dynamics. The PDFA gain dynamics are independent of pulse shape or modulation format due to a long upper-state lifetime that leads to negligible cross-talk between adjacent channels. For a comparison between the resulting PDFA and SOA eye diagrams, please see the PDFA vs. SOA tab. Featuring a ripple-free, or flat, gain spectrum, the PDFA produces uniform gain over a number of channels, which eliminates channel mismatches at the end of a link. The resulting clean, stable output is ideal for improving the power budget in data center applications.

Reza Salem
BU Leader
Laser Systems and Technology
Feedback?
Questions?
Need a Quote?

As shown in Figure 1.3, the main components of a PDFA include a wavelength-division multiplexer (WDM), input and output isolators, and a PDF. The WDM is used to combine the 980 nm pump laser and O-band signal light before the PDF, while the isolators, which only allow light to travel in one direction, prevent lasing by minimizing back reflections. The input and output isolators also serve to prevent any spontaneous emission signal from entering the amplifier and the pump light from exiting the O-band optical amplifier, respectively.
Gain Flattening Filter
To flatten the gain spectrum of the PDFA100(X) fiber amplifier for applications that require equal gain across a wide spectral range, Thorlabs offers a gain flattening filter (sold separately below). The filter is offered in an SM model for compatibility with both SM O-band fiber amplifier form factors.
OEM Capabilities
For OEM customers, the PDFA100X module can be adapted to fit conveniently into other platforms; the 100 mm x 164 mm x 38 mm amplifier module core sets the minimum dimensions required. The front panel can be customized or eliminated entirely to suit the user's needs. The rear panel is also configurable for the user's power and communication protocols. See the OEM Capabilities tab for more details.
| Amplifier Specificationsa | ||
|---|---|---|
| Item # | PDFA100(X) | PDFA100P |
| Operating Wavelength Rangeb | 1280 - 1330 nm (O-Band) | |
| Input Power Range | -30 to 10 dBm | |
| Output Power (@ 3 dBm Input Power)c,d | >16 dBm | >15 dBm |
| Small Signal Gain (@ -30 dBm Input Power)c | >24 dB | |
| Noise Figure (@ -30 dBm Input Power)c | <7 dB (6 dB Typ.) | <8 dB (7 dB Typ.) |
| ASE Output Powere | 2 mW (Typ.) | |
| Signal Latency (Input - Output) | <100 ns | |
| Pump Laser | 980 nm | |
| Laser Class | 1M | |
| Fiber Specifications | ||
|---|---|---|
| Item # | PDFA100(X) | PDFA100P |
| Output Polarization | Random | Linear, Aligned to Slow Axis |
| Polarization Extinction Ratio | N/A | >20 dB |
| Polarization-Dependent Gain | <0.5 dB | N/A |
| Return Loss at Input Port | >50 dB | |
| Input / Output Isolation | >30 dB | |
| Input / Output Fiber Type | SMF-28-J9 Single Mode Fiber |
Fujikura SM13-PS-U25A Polarization Maintaining Fiber |
| Input / Output Fiber Connectors | FC/APC Compatible, 2.0 mm Narrow Key | |
| Absolute Maximum Ratings | |
|---|---|
| Absolute Maximum Input Power | 10 mW (10 dBm) |
| Absolute Maximum Output Power | 150 mW (22 dBm) |
| Operating Temperature | 5 to 45 °C |
| Storage Temperature | -10 to 40 °C |
| General Specifications | |||
|---|---|---|---|
| Item # | PDFA100 | PDFA100P | PDFA100X |
| Input Voltage | 100 - 240 VAC, 50 - 60 Hz | - | |
| Input Power | 20 W (Max) | - | |
| Fuse Rating | 2 A, 250 V | - | |
| Fuse Type | Time-Lag (Slow-Blow) | - | |
| Fuse Size | 5 mm x 20 mm | - | |
| Electrical Power (From PXIe Chassis) |
- | 12 W (1 A @ 12 V)a | |
| Dimensions (W x D x H) | 250.0 x 300.0 x 122.2 mm (9.84" x 11.81" x 4.81") | 128.7 x 40.3 x 207.2 mm (5.07” X 1.59” X 8.16”) |
|
| Weight | 3.4 kg (7.5 lbs) | 0.45 kg (1 lb) | |
Performance Graphs
Performance may vary from unit to unit; this data reflects the typical performance of our PDFAs, and is presented for reference only. The guaranteed specifications are shown in the Specs tab.
Wavelength Dependence
Click to Enlarge
Click for Raw Data
The typical gain as a function of the wavelength. The blue-shaded region denotes the specified operating wavelength range. Data is measured with the pump level set at 100% (Item #s PDFA100 and PDFA100P) or 1200 mA (Item # PDFA100X).
Click to Enlarge
Click for Raw Data
The typical noise figure as a function of the wavelength. The blue-shaded region denotes the specified operating wavelength range. Data is measured with the pump level set at 100% (Item #s PDFA100 and PDFA100P) or 1200 mA (Item # PDFA100X).
Input Power and Pump Level Dependence at 1310 nm
Click to Enlarge
Click for Raw Data
The typical output power as a function of input power at 1310 nm. Data is measured with the pump level set at 100% (Item #s PDFA100 and PDFA100P) or 1200 mA (Item # PDFA100X).

Click to Enlarge
Click for Raw Data
The typical noise figure as a function of input power at 1310 nm. Data is measured with the pump level set at 100% (Item #s PDFA100 and PDFA100P) or 1200 mA (Item # PDFA100X).
Click to Enlarge
Click for Raw Data
The typical gain as a function of input power at 1310 nm. Data is measured with the pump level set at 100% (Item #s PDFA100 and PDFA100P) or 1200 mA (Item # PDFA100X).

Click to Enlarge
Click for Raw Data
The typical gain as a function of pump level at 1310 nm. Please note that the pump current level for the PDFA100 or PDFA100P system is specified as a percentage (bottom axis) and the pump current level for the PDFA100X module is specified in mA (top axis). The maximum current in the PDFA100X module is 1200 mA, and all current values can be converted to percentage by normalizing the value to the 1200 mA maximum.
ASE Power Spectral Density Spectrum
Click to Enlarge
Click for Raw Data
The typical amplified spontaneous emission (ASE) power spectral density spectrum. Total ASE power for a typical unit is about 2 mW. Data is measured with the pump level set at 100% (Item #s PDFA100 and PDFA100P) or 1200 mA (Item # PDFA100X).
Distortion-Free Amplification

Click to Enlarge
Figure 4.2 50 Gbaud/s Eye Diagram for a Commerically Available SOA with Input Power of -3 dBm and Output Power of 10 dBm
Click to Enlarge
Figure 4.1 50 Gbaud/s Eye Diagram for the PDFA100 Fiber Amplifier with Input Power of -3 dBm and Output Power of 10 dBm
One advantage of Praseodymium-Doped Fiber Amplifiers (PDFAs), in comparison to semiconductor optical amplifiers (SOAs), is their slow gain dynamics. Communication signals include pulse sequences with random patterns. In the simple case of an on-off-keying (OOK) and non-return-to-zero (NRZ) format, the pulses have identical amplitudes but their width can vary from one bit period (20 ps for 50 Gb/s data rate) to many bit periods, depending on the type of data being transmitted. As a result, if the amplifier gain saturation has a time constant comparable to the bit period, the gain of the amplifier exhibits pattern dependence. This effect can result in severely distorted optical signals when the amplifier is driven into saturation. SOAs typically have carrier lifetimes on the order of tens of picoseconds, and pattern dependence is observed at standard communication data rates when they are driven into saturation. In contrast, PDFAs have an upper-state lifetime in the millisecond range, which makes them immune to this pattern dependence. This distinguishing characteristic between SOAs and fiber amplifiers has been previously studied for OOK with return-to-zero (RZ) and NRZ modulation formats1. Signal distortion becomes a more severe issue in modern modulation formats, such as 4-level pulse amplitude modulation (PAM4).
Figures 4.1 and 4.2 are measured by amplifying a 50 GBaud/s PAM4 signal with a 27-1 pseudo-random bit sequence (PRBS) using both a Thorlabs' PDFA100 amplifier (Figure 4.1) and a commercially available SOA (Figure 4.2). The input power from both amplifiers is set at -3 dBm, output power from both amplifiers is set to 10 dBm, and the output signal from each amplifier is attenuated and sent into a high-speed receiver. A comparison of the two diagrams illustrates that the PDFA produces an open eye diagram with minimal distortion, while the SOA saturation dynamics cause significant distortion to the eye diagram. These eye diagrams were measured using Thorlabs' MX65E-1310 65 GHz Linear Reference Transmitter and RXM40AF Ultrafast Receiver. The PDFA100X module will provide the same optical performance as the PDFA100 benchtop unit.
Footnotes
- R. C. Schimmel, R. J.W. Jonker, P. K. van Bennekom, Giok-Djan Khoe, and H. de Waardt, "Experimental assessment of 1.3-µm telecommunication systems incorporating a praseodymium-doped fiber amplifier (PDFA)," Proc. SPIE 4833, Applications of Photonic Technology 5, 2003.
The Praseodymium-Doped Fluoride Fiber Amplifier (PDFA) achieves signal gain through stimulated emission, which is when an incident photon causes an excited-state ion to relax to a lower energy state by emitting a photon. For this fiber amplifier, silica cannot be used as the host material because the excited state decays to the ground state nonradiatively via phonon relaxation. Materials with lower phonon energies, such as fluorides or chalcogenide glasses, are more suitable hosts. Thorlabs uses proprietary fluoride fiber doped with the rare-earth metal praseodymium to generate radiative emission and achieve signal gain.
Click to Enlarge
Figure 5.1 Schematics showing Pr3+ ion excitation and emission processes. 3H4, 3H5, and 1G4 are the ground, intermediate, and excited energy levels, respectively.
Stimulated Emission in the PDFA
The excitation and relaxation process in the Pr3+ ion behaves like a three-level system involving the ground state 3H4, metastable state 1G4, and intermediate state 3H5. In particular, when a ground state Pr3+ ion is pumped with a laser, the ion is excited to a metastable state with a long lifetime on the order of hundreds of microseconds. This long lifetime allows for population inversion, which means that the number of ions in the metastable state builds up and becomes larger than the number of ions in the ground state. The ion sits in the metastable state until a signal photon, with an energy matching the energy difference between the excited state and intermediate state, causes the ion to relax down to its ground state by photon emission. For the Pr3+ ion, this energy corresponds to a wavelength around 1310 nm. The ion then fully decays to the ground state through nonradiative phonon relaxation. Absorption and stimulated emission, as well as the relevant energy states, are illustrated in the first two panels of Figure 5.1.
Note that the electronic states of the Pr3+ ion are energy bands and not discrete energy levels, and there is a range of wavelengths the emission processes occur over, i.e. the PDFA bandwidth. This is as a result of the Stark-splitting caused by the local electric fields from the surrounding host lattice acting on the Pr3+ ion, as well as site-to-site variation within the amorphous host.
Stimulated vs. Spontaneous Emission
Signal amplification occurs when the ion relaxes via stimulated emission because one signal photon in results in two signal photons out; this second photon has the same energy, phase, and direction as the incident signal photon (coherent radiation). If the excited ion is not triggered during the span of the metastable state lifetime, the ions relax on their own via spontaneous emission. As shown in the last panel of the schematic, these photons have random phase and direction. While most of the photons generated by spontaneous emission will leave through the sides of the fiber, some propagate through the fiber core and experience signal gain, resulting in noise called amplified spontaneous emission (ASE).
PDFA100 an PDFA100P Benchtop Systems Front and Back Panels
Click to Enlarge
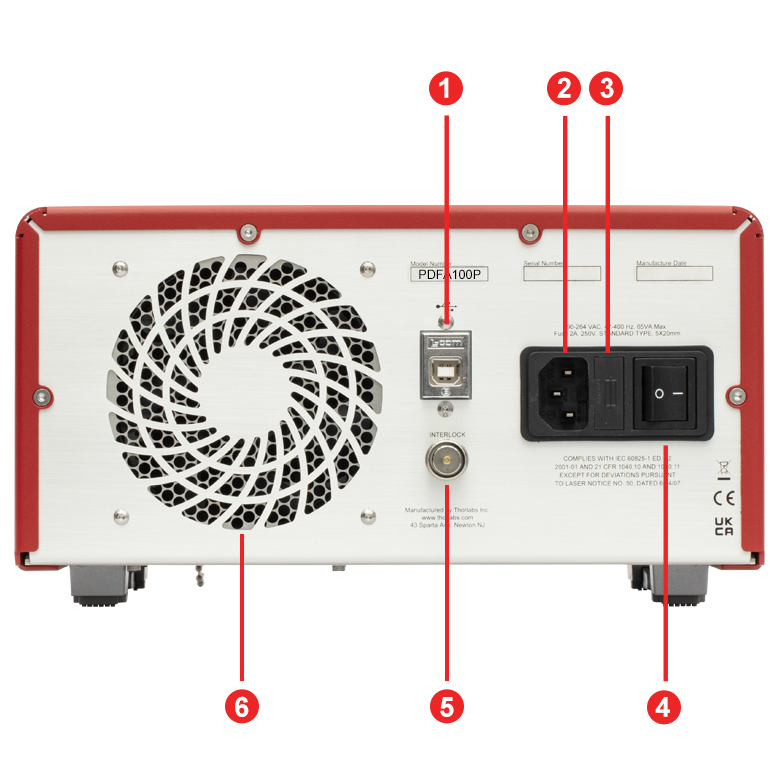
Figure 6.2 Back Panel
Click to Enlarge
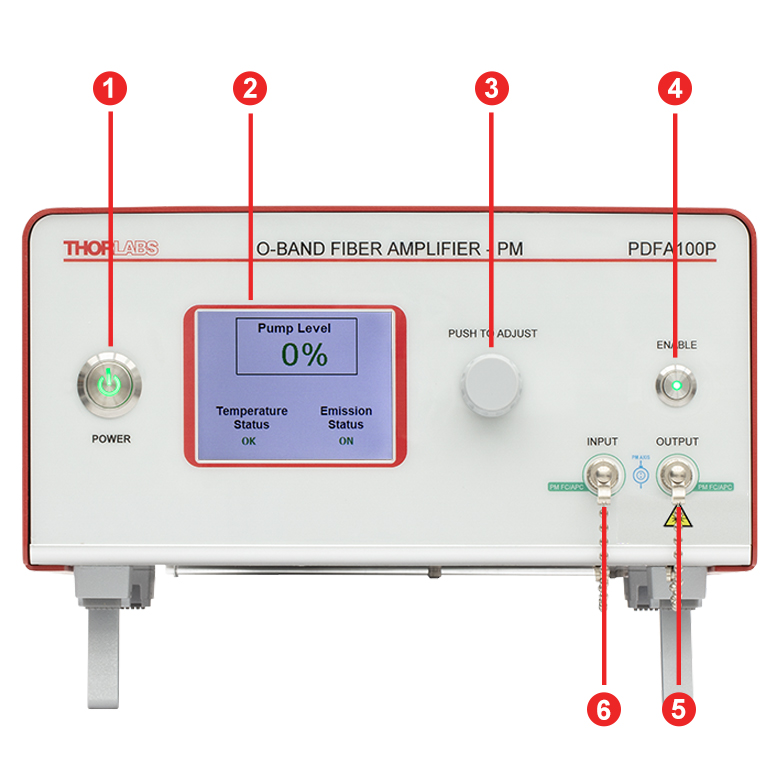
Figure 6.1 Front Panel
| Back Panel | |
|---|---|
| Callout | Description |
| 1 | USB Type B Port for Diagnostics and Remote Interface |
| 2 | AC Power Cord Connector |
| 3 | Fuse Tray |
| 4 | AC Power Switch |
| 5 | Remote Interlock Input (BNC) |
| 6 | Cooling Fana (Do Not Block) |
| Front Panel | |
|---|---|
| Callout | Description |
| 1 | Push-Button Power Switch |
| 2 | Display to Show Pump Level, Temperature Status, and Emission Status |
| 3 | Control Knob to Adjust Pump Laser Current |
| 4 | Amplifier Enable Switch and Emission Indicator |
| 5a | Optical Output for FC/APC Fiber Connector |
| 6a | Optical Input for FC/APC Fiber Connector |
PDFA100X Front Panel
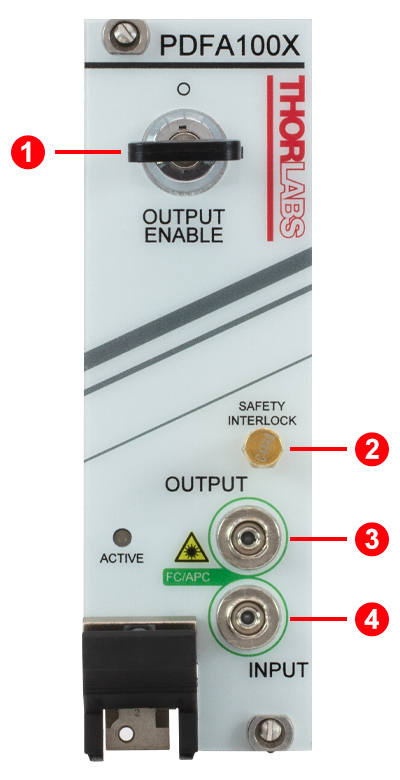
| Callout | Description |
|---|---|
| 1 | Output Enable Key-Lock Switch |
| 2 | Remote Interlock Connector: SMB Female |
| 3 | Output: FC/APC |
| 4 | Input: FC/APC |
Click to Enlarge
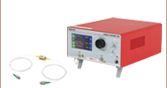
Figure 7.1 Components Shipped with the PDFA100 or PDFA100P Benchtop System
The PDFA100 and PDFA100P Amplifiers contain the following components:
- Praseodymium-Doped Fiber Amplifier in Benchtop Package
- Interlock-Shorting BNC Connector
- Region-Specific Power Cord
- USB-A-79 High Speed USB 2.0 Type-A to Type-B Cable, 79" (2 m) Long
- FBC250 Connector and Bulkhead Cleaner
The PDFA100X Amplifier contains the following components:
- Praseodymium-Doped Fiber Amplifier in PXIe-Compatible Module Package
- Key to Activate Module
Click to Enlarge
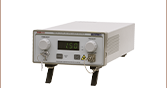
Figure 8.1 PDFA100X Standard Module Package
Reza Salem
BU Leader
Laser Systems and Technology
Need a Quote?
PDFA Module for OEM Applications
For OEM customers, the PDFA100X package can be adapted to fit conveniently into other platforms; the 100 mm x 164 mm x 38 mm amplifier module core sets the minimum dimensions required.
All PDFAs integrate telecom-grade 980 nm pump lasers for reliable long-term operation and maximal uptime.
The PDFA100X front panel can be customized or eliminated entirely to suit the user's needs. The rear panel is also configurable for the user's power and communication protocols.
The PDFA100X package is available for single mode operation. However, if your application requires a polarization-maintaining PXIe module, please contact us to discuss this option.
Click the "Contact Me" button to discuss the customization requirements for your OEM module.
Fluoride Glass Characteristics
Fluoride fibers, used throughout the PDFA, are ideal for transmission in the mid-IR wavelength range and have lower refractive indices and lower chromatic dispersion than other fibers that transmit in this range, such as chalcogenide glass fibers. The heavy glass matrix of fluoride glass avoids quenching certain transitions in rare-earth-doped glass, which underlie the gain mechanism of the PDFA.
Thorlabs' Fluoride Fiber Manufacturing
The fluoride fiber used in our PDFA is manufactured at our fiber draw facility, located in Newton, NJ. The vertically integrated facility is well-equipped for high-volume manufacturing and is capable of producing many kilometers of fiber per year, enabling production of hundreds of amplifiers in the same time frame. In addition, because the fiber stays within Thorlabs' facilities from start to finish, the manufacturing parameters can be adjusted to accommodate unique custom orders or R&D needs.
Thorlabs' stringent manufacturing processes yield low attenuation over the mid-IR range as well as an extremely low hydroxyl ion (OH) content. Our tight quality control allows us to mitigate scattering and point defects in the fiber and to eliminate micro-crystallization in the glass matrix, which would otherwise reduce the performance of the fiber amplifier.
Click here to learn more about our in-house fluoride fiber manufacturing.
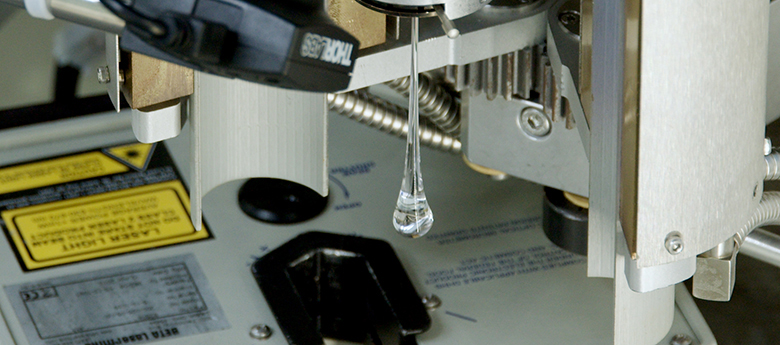 Click to Enlarge Figure 8.2 A Glass Drop During the Fiber Draw Process |
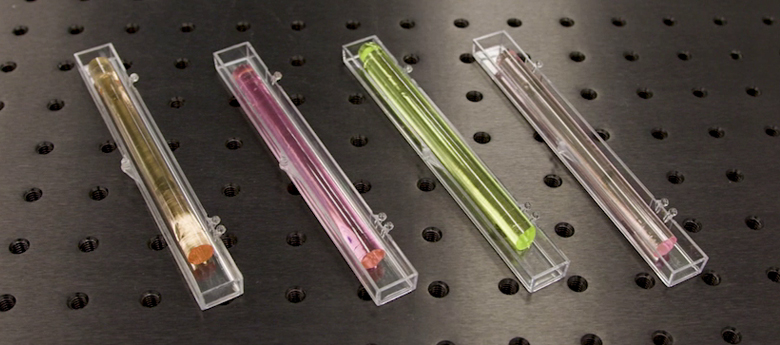 Click to Enlarge Figure 8.3 Rare-Earth-Doped Fluoride Glass Preforms |
| Posted Comments: | |
SeungYu Jeong
(posted 2025-10-28 07:54:15.197) Hello,
I am currently working in the field of fiber-based femtosecond lasers, and I have been looking for a product capable of amplifying pulses in the O-band region.
Specifically, I am interested in the following model:
PDFA100P
since we are conducting research with femtosecond pulse lasers, I would like to confirm whether this amplifier can safely handle femtosecond-level pulse durations as input light.
Your advice or any relevant technical guidance on this matter would be greatly appreciated.
Thank you very much for your time and support. ksosnowski
(posted 2025-10-30 01:05:29.0) Hello SeungYu, and thanks for reaching out to us. The PDFA100P can handle femtosecond pulses, however for this amplifier type we do not currently have an accurate number for dispersion and nonlinearity of gain of the fluoride fiber used. The overall fiber length in the unit is approximately 20 m, which may require some pre chirp or post compression depending on the application. Your 1300nm/2mW laser is well within the specified operating range for the device. The performance plots and data can be viewed under the ‘Graphs’ tab above for more details including typical output vs input power. I have reached out directly to discuss your application in further detail. |

 Zoom
Zoom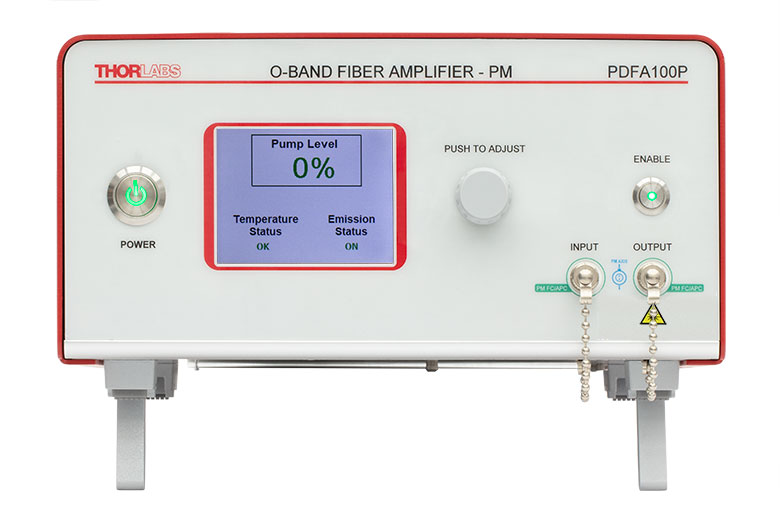
Click to Enlarge
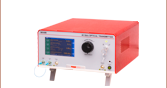
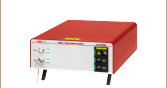
Figure G1.1 Front Panel of the PDFA100P Allows Turnkey Operation
- Turnkey Operation
- FC/APC Input and Output Connectors
- Benchtop Package with Display Screen
- Single-Mode or Polarization Maintaining Models Available
Each PDFA100 or PDFA100P O-Band Optical Amplifier is enclosed in a compact benchtop package with FC/APC (2.0 mm narrow key) input and output connectors. The PDFA100 amplifier is a single mode PDFA with minimal sensitivity to the input light polarization, while the PDFA100P amplifier is a polarization-maintaining PDFA that only amplifies light along the slow axis of the fiber. Each instrument's front panel includes an adjustment knob for tuning the pump current of the PDFA. These devices also feature a display screen that shows the pump level, as well as the temperature and emission status. To show when the internal laser is active, an indicator LED is included on the enable button; this will blink rapidly for three seconds before the amplifier turns on. Closed-loop operation allows these devices to operate in constant power and constant gain modes using a command-line interface via USB connection with a PC.
For additional safety, the user may connect an interlock circuit to the BNC connector on the rear panel. The PDFA100 and PDFA100P amplifiers use a universal power supply allowing operation over 100 - 240 VAC without the need to select the line voltage. A region-specific power cord is included.

 Zoom
Zoom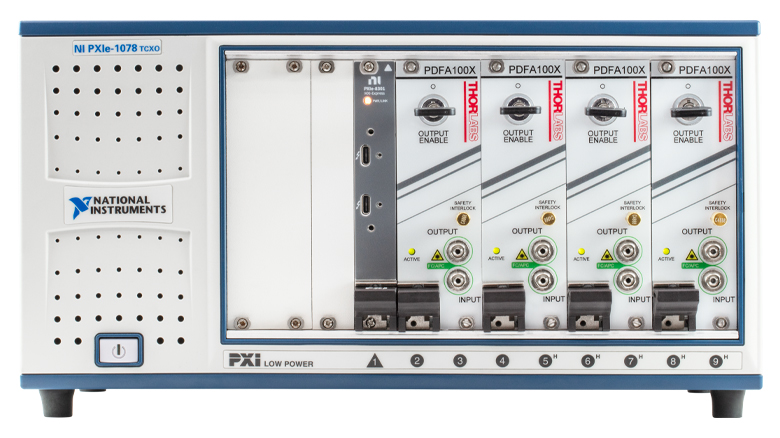
Click to Enlarge
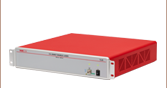
Figure G2.1 Four PDFA100X Modules in a PXI-Compatible Chassis
- Compact PXIe Packaging
- Identical Optical Performance to the PDFA100 Benchtop Amplifier
- Customizable Front and Back Panel (Contact Us for Details)
The PDFA100X PXI Express (PXIe) Plug-In Module offers identical optical performance to the single mode PDFA100 benchtop amplifier. For applications that require a polarization-maintaining PXIe module, please contact us. This PXIe module offers seamless integration into new or existing PXI test and measurement setups and is compatible with a broad range of existing electrical and optical plug-in modules. Additionally, the small form-factor of the PDFA100X's 2-slot PXI card saves space, power consumption, and cost especially when multiple PDFA modules are required to operate in parallel. The module is ready to use when plugged into any PXIe-compatible chassis (not sold by Thorlabs). Figure G2.1 shows an example where four PDFA100X amplifiers are plugged into a 9-slot chassis.
The PDFA100X module is fully controlled through the PXI chassis using a PXI controller module and can be recognized as a serial port on a computer allowing serial communications with the device. A list of control commands are available through the PDFA100X manual. Additionally, a LabVIEW interface, which can operate multiple PDFA cards plugged into one PXIe chassis, can be provided upon request. Please contact us with any inquiries.
 Amplifiers")
 Zoom
Zoom
Click to Enlarge
Figure G3.1 The average gain response of the PDFA100(X) amplifier with and without the GFFP13 gain flattening filter for different input powers. The blue-shaded region indicates the gain-flattening wavelength range. The filter is optimal for a -10 dBm input power; the gain flatness improves from ~8 dB (solid red line) to <1 dB with the filter (dashed red line). The gain flatness at -20 dBm input power is also improved as shown here. The gain spectrum with 0 dBm input power (solid blue line) is overcorrected by the filter, yielding a similar flatness level (dashed blue line).
- Flatten Gain Spectrum of PDFA100(X) Series O-Band Fiber Amplifiers
- 1270 - 1330 nm Operating Wavelength Range
- Optimized for a -10 dBm Input Power
- Available in SM Version
Thorlabs' GFFP13 Gain Flattening Filter is designed for use with the O-band praseodymium-doped fiber amplifiers (PDFAs). The filter uses SMF-28 fiber and is compatible with both the single mode PDFA100 and PDFA100X amplifiers. This filter is intended to be connected to the output port of the PDFA and is designed to flatten the gain spectrum of the fiber amplifiers for applications that require equal gain across a wide spectral range. The gain spectrum of the PDFAs depends on the input power level with the gain variations increasing over the operating wavelength range as the input power is decreased. The design transmission curve of the filter, given in Table G3.2, flattens the gain of the PDFA100 series at -10 dBm input power.
One of the key specifications for the gain flattening filter is the peak-to-peak error function, which is defined as the difference between the measured transmission curve (in dB) and the design transmission curve (in dB). Each filter will have a transmission profile that deviates from the design curve to some level, and the error function captures this variation over the wavelength range. The peak-to-peak error function is a single valued specification defined as the difference between the maximum error function and the minimum error function. That value in dB is given in Table G3.2.
Figure G3.1 shows the typical PDFA100 amplifier gain versus wavelength for three different input power levels (0 dBm, -10 dBm, and -20 dBm). The filter is designed to provide optimal gain flatness at a -10 dBm input power level, as seen in Figure G3.1. The gain flatness at -10 dBm input power over the 1270 - 1330 nm wavelength range is improved from ~8 dB without the filter to <1 dB after placing the GFFP13 filter. Similarly, the gain flatness at -20 dBm input power can be improved from ~10 dB to <5 dB over the same wavelength range by adding the filter. Since the gain spectrum of the PDFA100 amplifier for 0 dBm input power level is more flat than the gain spectrum at -10 dBm, the gain flattening filter overcorrects the spectrum yielding a similar overall flatness to the spectrum without using the GFFP13 filter.
| Table G3.2 Specifications | |
|---|---|
| Item # | GFFP13 |
| Wavelength Rangea (Click for Design Profile) |
1270 nm - 1330 nm |
| Insertion Lossb | <0.8 dB |
| Peak-to-Peak Error Function | <0.6 dB |
| Polarization-Dependent Loss | <0.1 dB |
| Return Loss | >50 dB |
| Connector Type | FC/APC |
| Fiber Type |
SMF-28 In White Ø900 μm Tubing |
| Compatible Amplifier | PDFA100(X) |