 Products Home
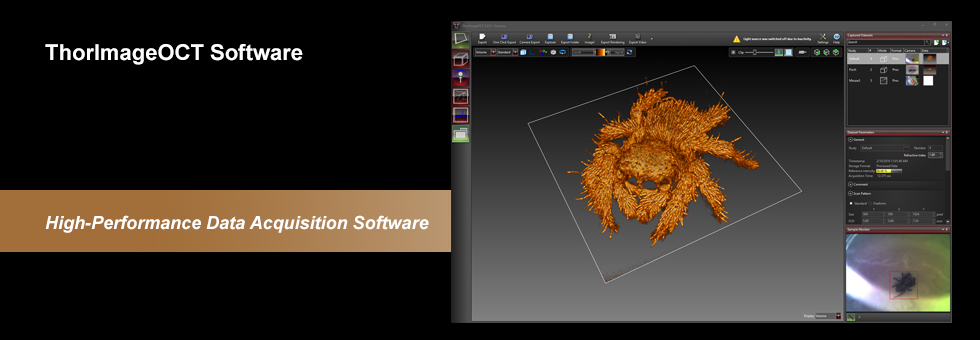

ThorImage®OCT Software
Software features:
- Live Acquisition and Simultaneous Display in 1D, 2D, and 3D
- Live Sample Monitor for Easy Sample Positioning and Adjustment of Scan Pattern
- Advanced Dataset Handling
- User Access from Calibration and Raw Data Through to Processed Data
- Various Data Export Options
- Time-Series Measurements
- Doppler, Speckle Variance, and Polarization-Sensitive (PS)a Acquisition Modes
- Lightweight API ThorImageAutomation (C, C#, LabVIEW and Python)
- Low-Level SDK APIs Available In C, LabVIEW, and Python
- Seamless Integration of User-implemented Python Processing in ThorImageOCT Environment
ThorImage®OCT is a high-performance data acquisition software that is included with all Thorlabs OCT systems. This 64-bit Windows-based software acquires and displays OCT data and includes scan control and processing options. Additionally, Python, NI LabVIEW®, and C-based Software Development Kits (SDKs) are available, which contain a complete set of libraries for measurement control, data acquisition, and processing, as well as for storage and display of OCT images. The SDKs provide the means for developing highly specialized OCT imaging software for any individual application. The Python user interface enables user-developed processing routines within the ThorImageOCT live view.
| Table 116B ThorImageOCT Documentation | |
|---|---|
| ThorImageOCT Software Manual | |
| Third-Party Software License Agreements | |
Video 116A shows OCT images of a finger being acquired and manipulated in ThorImageOCT. This is done using the 3D volume and cross section modes. The software manual and third-party license agreements are included in Table 116B.
Explore the functionality of the ThorImageOCT software by clicking the expandable Workspace, Capabilities, Feature Plugins, Integration, and Specifications bars below. See the Specifications bar for a complete list of features and compatibility.
- Specific PS system required.
Workspace
ThorImageOCT streamlines the image acquisition and analysis process with a user-intuitive, feature-rich workflow. Control panels are designed so that the most important features are readily available and users can quickly set up their experiment. Panel layouts are completely customizable for different use cases or imaging modalities. All software features are easily accessible from the main workspace window, providing a complete, self-contained software package.
Click the Highlighted Regions in Figure 116C to Explore the Workspace

Figure 116C ThorImageOCT Workspace Window
Capabilities
| Quick Links |
|---|
| Acquisition |
| Imaging Modes: 1D, 2D, and 3D Scan Control with Sample Monitor Probe Calibration Image Quality and Speed |
| Processing |
| Image Field Correction |
| Image Viewing |
| Viewing Options Dataset Management |
| Analysis |
| Despeckle Filter Marker Tool Surface Detection |
Acquisition
Imaging Modes
Different OCT imaging modes can be selected using the mode selector. If the ThorImageOCT software finds a compatible system connected and switched on, all operational modes will be selectable. If no OCT device is present, only the data viewing mode for viewing and OCT data export will be available.
Click to Enlarge
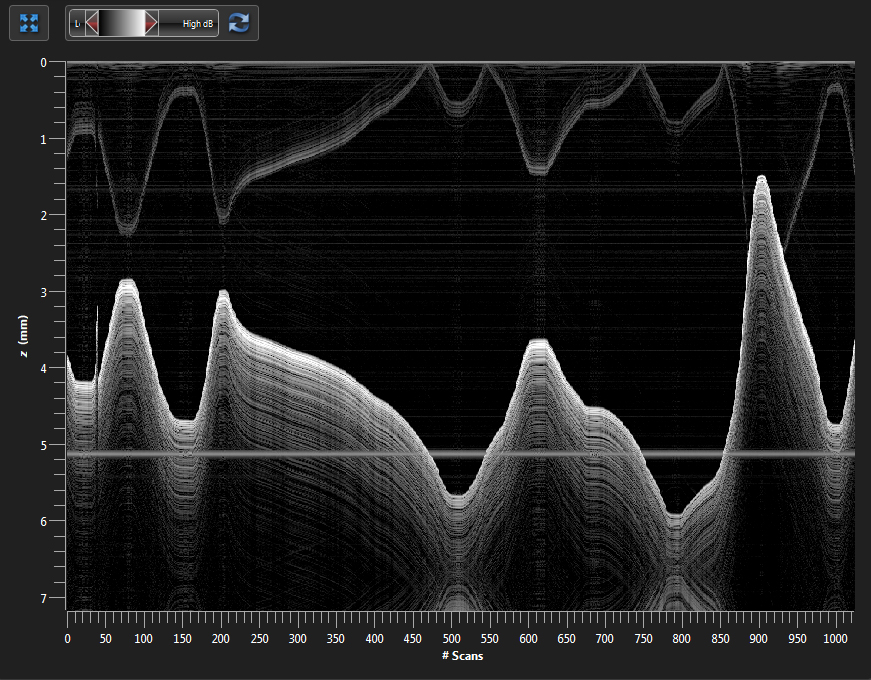
Figure 116E Several A-Scans at a Single Point Over Time (M-Scan)
Click to Enlarge
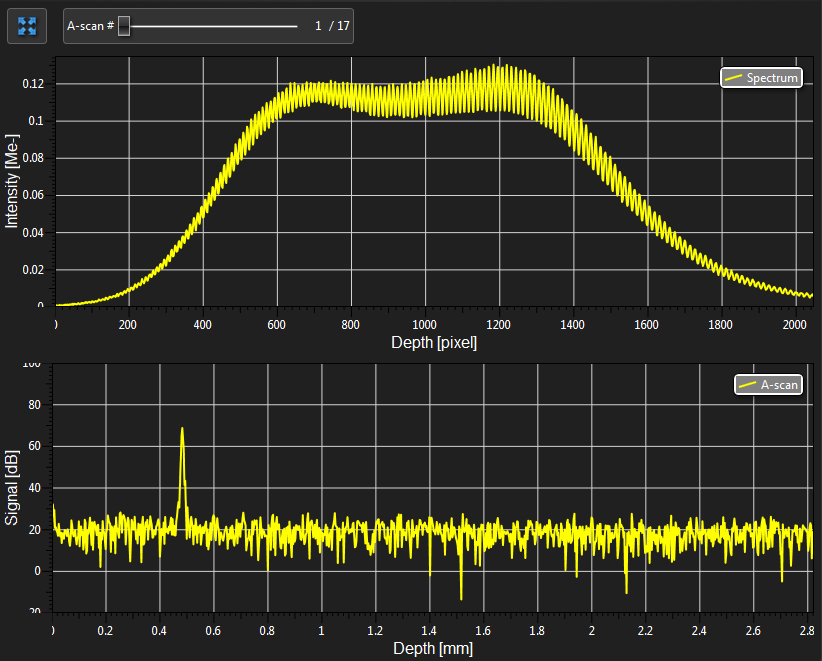
Figure 116D Spectral and Depth Information for a Single Point (A-Scan)
1D Mode
In this mode, single-point measurements can be made that provide spectral and depth information, as well as the ability to observe time-related sample behavior with an M-scan.
Click to Enlarge
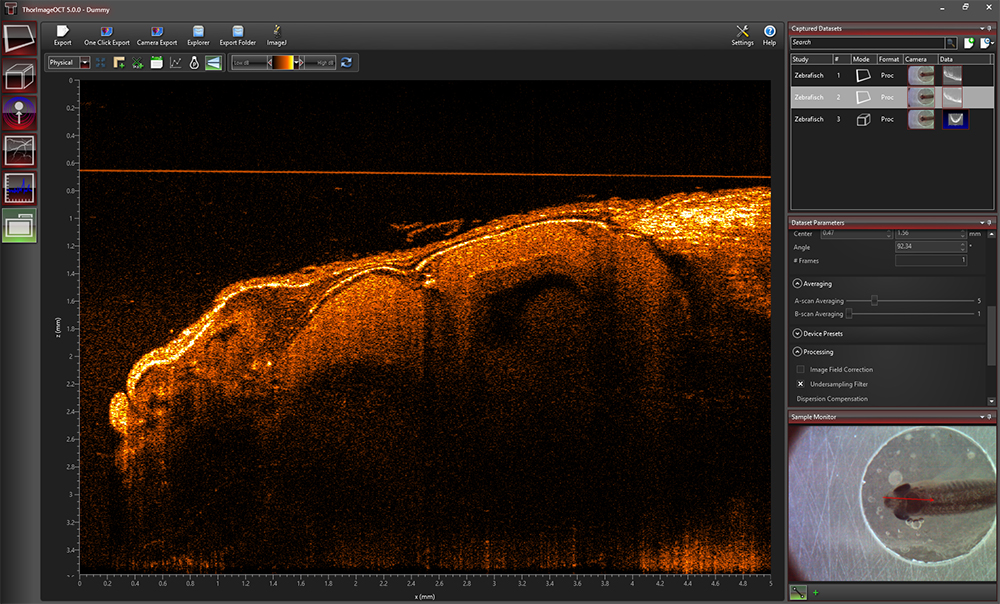
Figure 116F ThorImageOCT Window in the 2D Mode
2D Mode
In the 2D imaging mode, the probe beam scans in one direction, acquiring cross-sectional OCT images that are then displayed in real time. Acquisitions can be stored with Snapshot and Advanced Snapshot. Advanced Snapshot provides optimized averaging options for higher image quality. For long term measurements, a time series function with an adjustable time interval between two acquisitions is included. Image display parameters, such as color mapping, can be controlled in this mode. We have also implemented an option for automatic calculation of the optimum contrast and brightness of the displayed OCT images.
Click to Enlarge
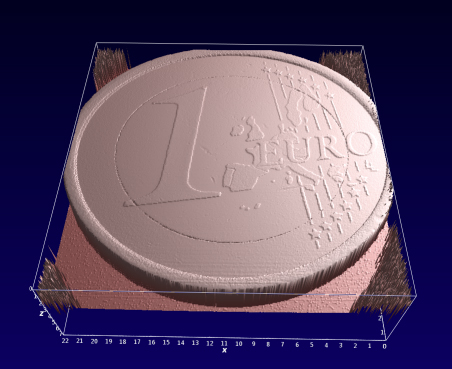
Figure 116G Rendering View in ThorImageOCT
3D Mode
In the 3D imaging mode, the OCT probe beam scans sequentially across the sample to collect a series of 2D cross-sectional images that are then processed to build a 3D image.
Utilizing the full potential of our high-performance software in combination with our high-speed OCT systems, we have included a Fast Volume Rendering Mode in the ThorImageOCT software, which serves as a preview for high-resolution 3D acquisitions. In this mode, high-speed volume renderings can be displayed in real-time, providing rapid visualization of samples in three dimensions.
To accommodate long term measurements, a time series function that takes a series of 3D measurements is available. The number of volumes to be acquired and the time interval between scans are adjustable.
Click to Enlarge
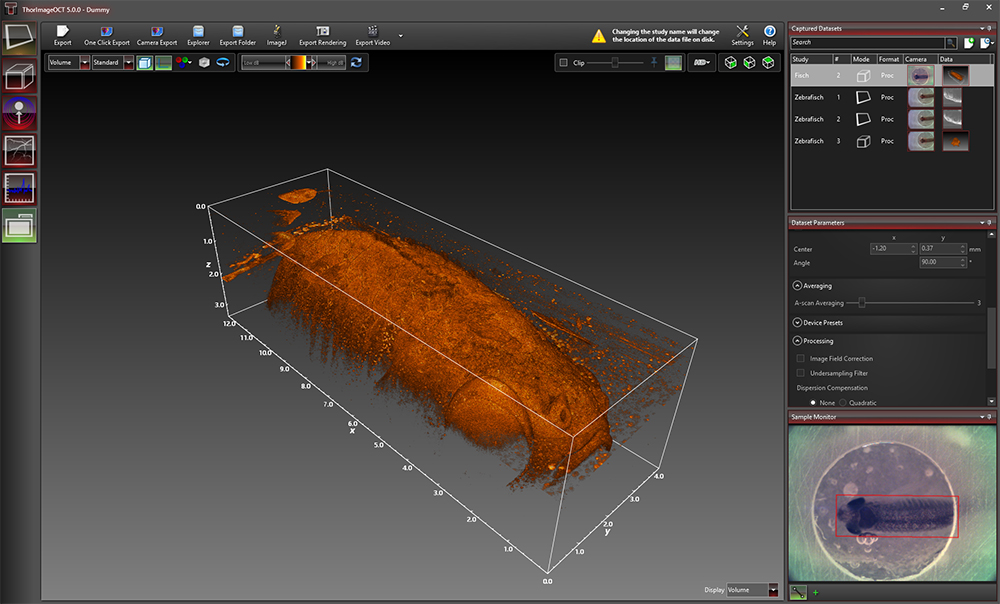
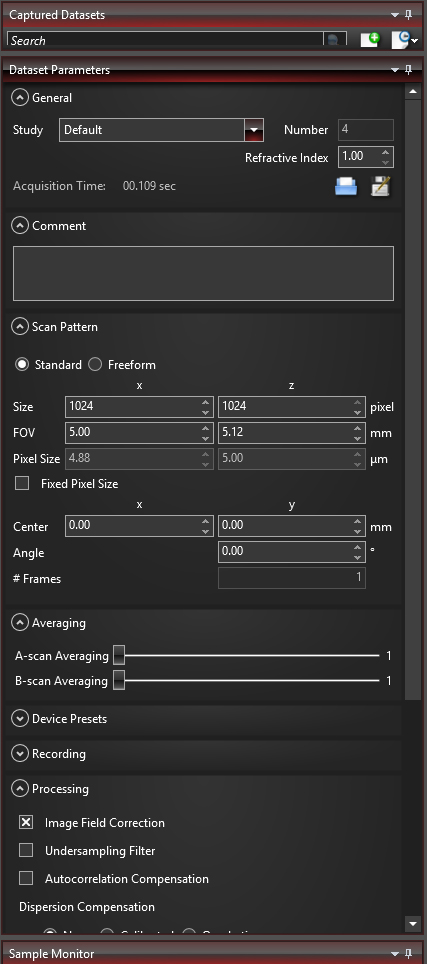
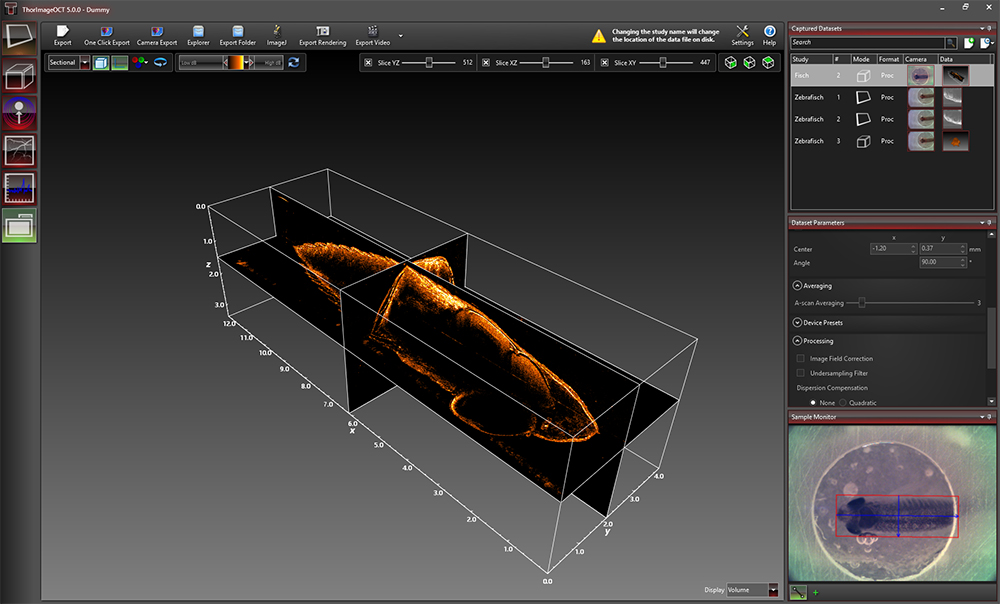
Figure 116H Various acquisition parameters can be adjusted in ThorImageOCT.
Scan Control with Sample Monitor
ThorImageOCT provides numerous scan and acquisition controls. The camera integrated in the scanner of our OCT systems provides live video images in the application software. Defining the scan line for 2D imaging or the scan area for 3D imaging is accomplished through the easy-to-use "Draw and Scan" feature by clicking on the video image.
Click to Enlarge
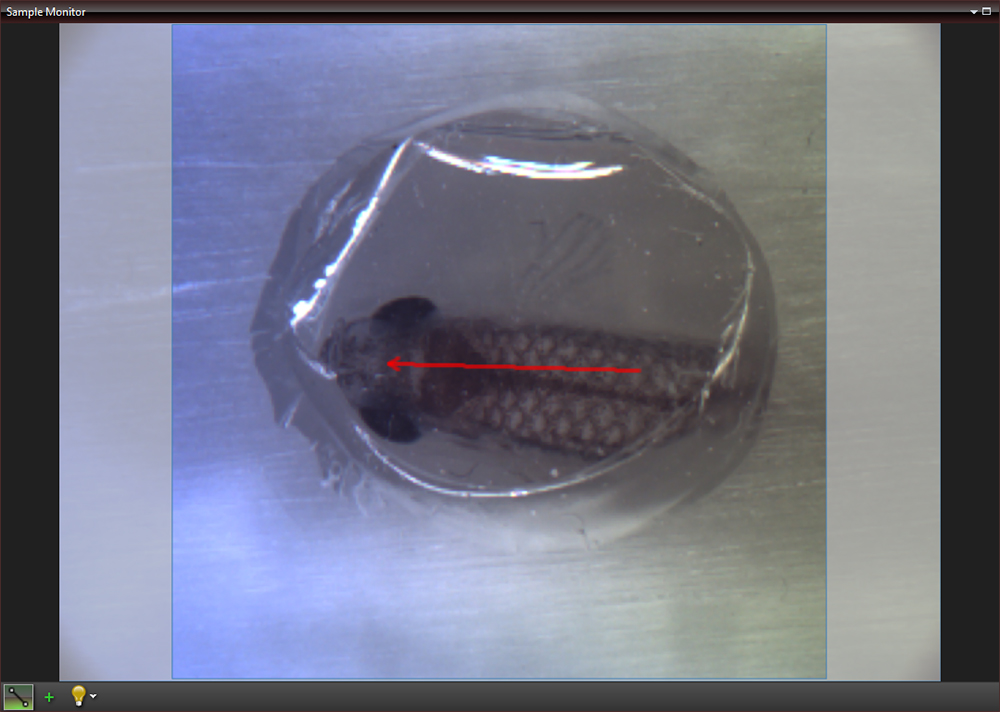
Figure 116J The Sample Monitor can be used to define the scan pattern using the "Draw and Scan" feature.
Arbitrary forms defined by the Draw & Scan feature or loaded .txt files can be scanned. The scan pattern can also be adjusted by specifying suitable parameters in the controls of the software, as shown in Figure 116H.
Click to Enlarge
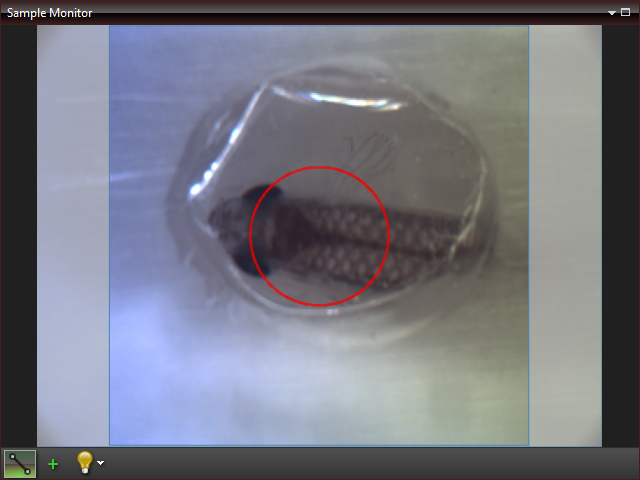
Figure 116K A predefined circle scan pattern can be loaded and scanned in the software. The size can be changed with the Zoom feature.
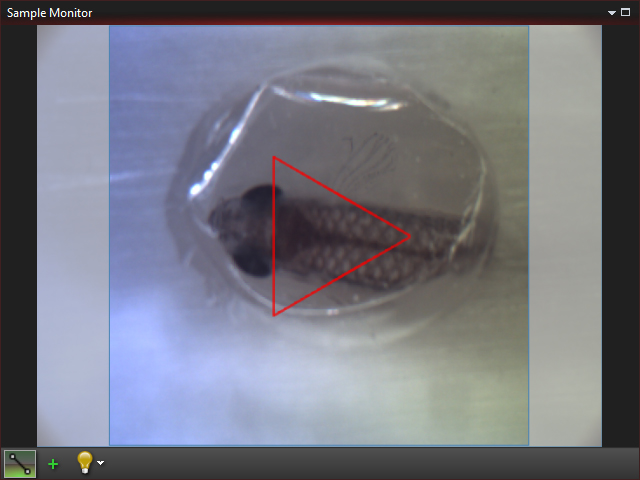
Click to Enlarge
Figure 116L A predefined triangle scan pattern can be loaded and scanned in the software. The size can be changed with the Zoom feature.
Additionally, one can further set processing parameters, averaging parameters, and the speed and sensitivity of the device using device presets. By using a high-speed preset, video-like frame rates in 2D and fast volume rendering in 3D are possible, whereas high-sensitivity acquisition is enabled by choosing a preset with a lower acquisition speed.
Click to Enlarge
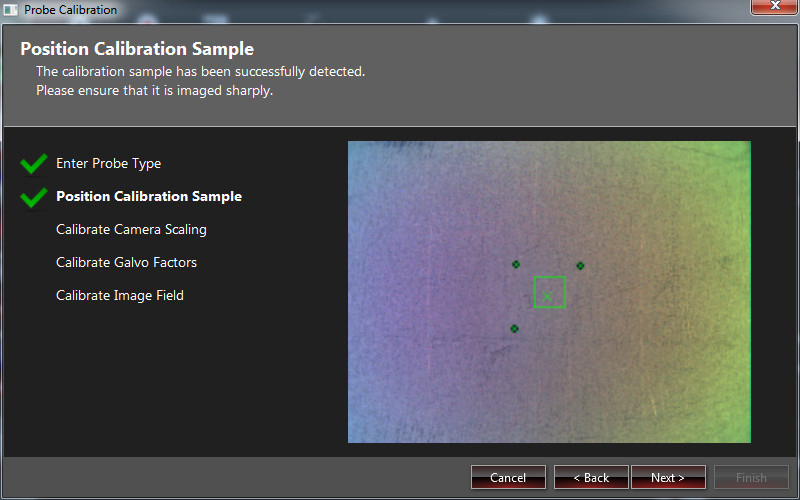
Figure 116M Probe Calibration Window in ThorImageOCT
Probe Calibration
Our camera and scanning system are calibrated to match the real lengths for the scan pattern parameter. Changing to a different scan lens kit will generally require a different probe configuration in order to adapt to changes in the optical parameters of the system. When an additional scan lens is purchased for your Thorlabs OCT scanner system, ThorImageOCT enables you to easily create a fitting configuration for your new scan lens by using the calibration sample shipped with the lens and an intuitive step-by-step calibration process (shown in Figure 116M).
Image Quality and Speed
Depending on the specific application, the balance between image quality and acquisition time may tend more towards one or the other. Several options based on the available hardware are provided to help reach the optimal balance for a given measurement.
Averaging
Averaging the spectra before the Fast Fourier Transform (FFT), or averaging the processed data with A-Scan averaging or B-scan averaging are two options available that can enhance the image quality or the acquisition speed.
Speed and Sensitivity
For camera based systems of the Ganymede and Telesto family, predefined presets of the acquistion speed can be chosen. By using a high-speed preset, video-live frame rates in 2D and fast volume rendering in 3D are possible, whereas high-sensitivity acquistion is enabled by choosing a preset with a lower acquistion speed.
Additional Controls
For the Vega and Atria System families, the Detector Gain is adjustable in ThorImageOCT. Additional controls to match the polarization state of the light from the sample and reference arm as well as a software integrated reference stage to adjust optical length of the reference arm are included.
Processing
ThorImageOCT provides features specifically designed to improve the quality of OCT images. The data can be modified during acquisition using processing parameters, such as image field correction, dispersion correction, and undersampling filters, or afterwards with filters.
Image Field Correction
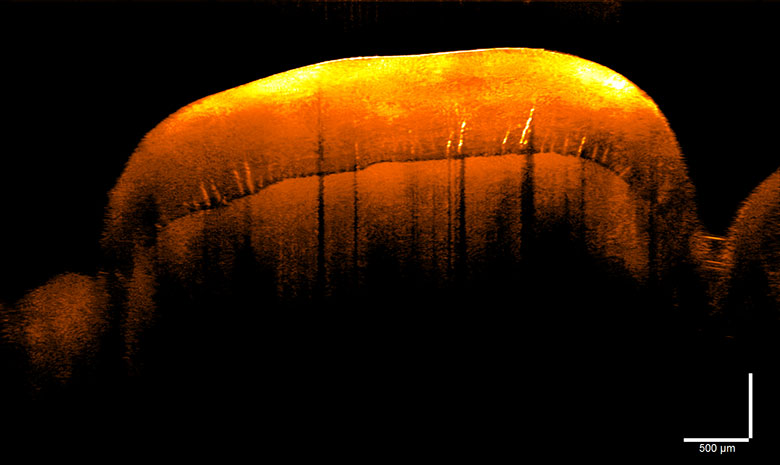
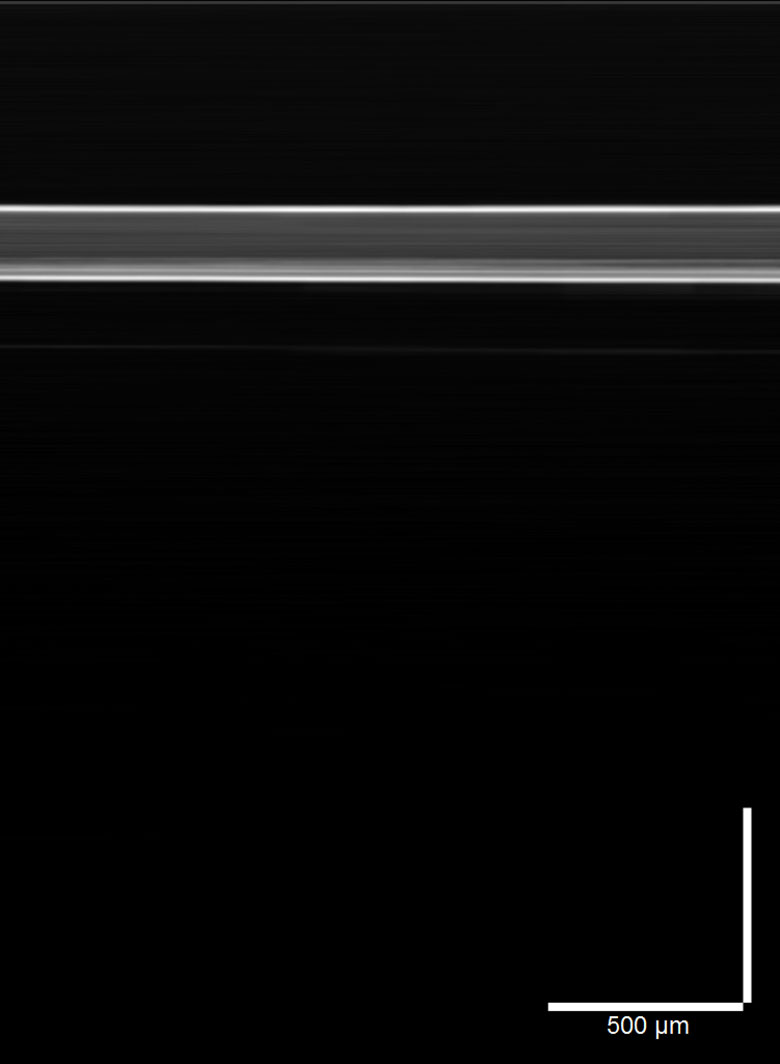
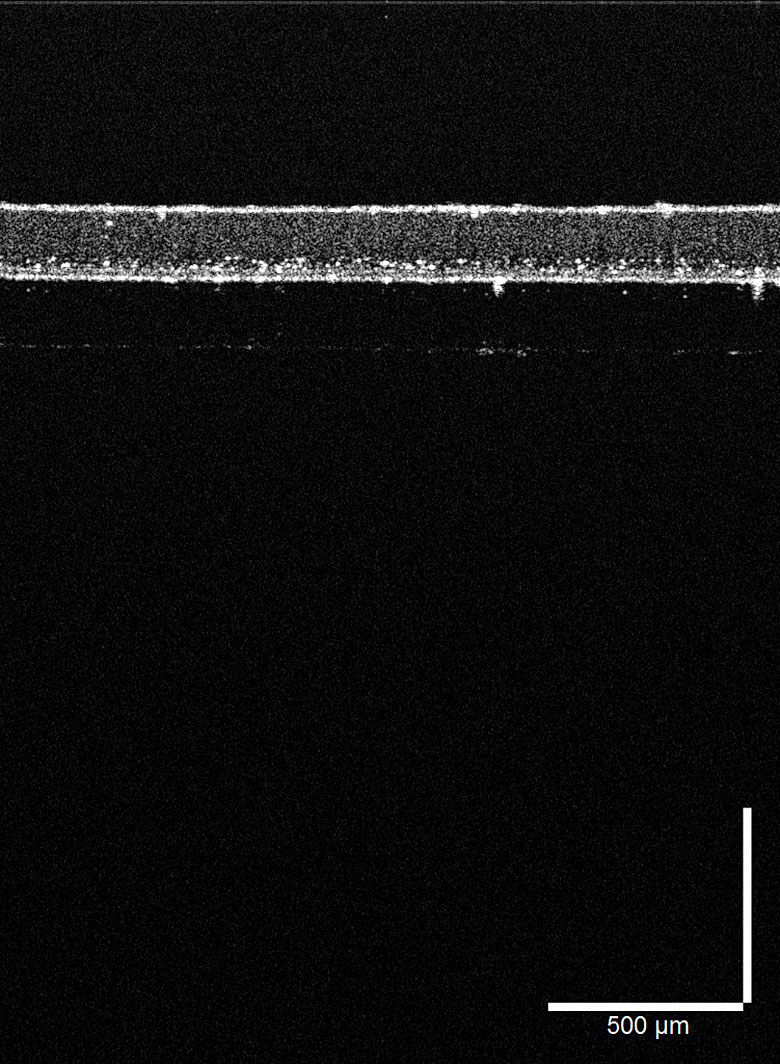
A calibrated image field correction is included by default with the system. This corrects optical distortions in the axial direction and is demonstrated on scotch tape in Figure 116N and Figure 116P.

Click to Enlarge
Figure 116P Image Field Correction Applied to an OCT Image of Scotch Tape

Click to Enlarge
Figure 116N OCT Image of Scotch Tape
If additional processing functions are desired, ThorImageOCT can also integrate user-defined processing and post-processing algorithms; see the External Programs and User Interface for Python Processing sections in the Integration tab below for more details.
Image Viewing
For all imaging modes, an offline mode is available to view acquired images with ThorImageOCT stored as .oct-files. All legacy .oct-files can be opened with the current version of ThorImageOCT.
Viewing Options
In the ThorImageOCT software, 3D volume datasets can be viewed as orthogonal cross-sectional planes (see Figures 116Q and 116R) and volume renderings. The Sectional View features cross-sectional images in all three orthogonal planes, independent of the orientation in which the data was acquired. The view can be rotated as well as zoomed in and out.
The Rendering View provides a volumetric rendering of the acquired volume dataset. This view enables quick 3D visualization of the sample being imaged. Clip planes of any orientation can be applied. The 3D image can be zoomed in and out as well as rotated. Furthermore, the coloring and dynamic range settings can be adjusted.
Click to Enlarge
Figure 116Q Sectional View in ThorImageOCT
Click to Enlarge
Figure 116R Rendering View in ThorImageOCT
Click to Enlarge
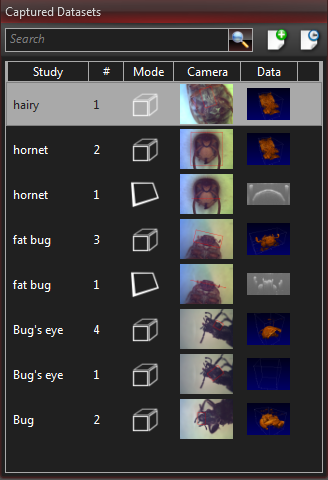
Figure 116T The Dataset Management Window of ThorImageOCT
Dataset Management
ThorImageOCT provides advanced dataset management capabilities, which allow several datasets to be opened simultaneously. Datasets are uniquely defined using an identifier consisting of a study (or test series) name and an experiment number. Grouping of datasets can be achieved by using the same study name. The "Captured Datasets" list shows an overview of all open datasets, including the dataset identifier, the acquisition mode, and preview pictures of the still video image and the OCT data.
.oct Files and Export
The OCT file format native to ThorImageOCT allows OCT data, sample monitor data, and all relevant metadata to be stored in a single file. ThorImageOCT can also be installed and run on computers without OCT devices in order to view and export OCT data. The user has full access to the raw and processed data from the device, including additional data used for processing, e.g. offset errors.
Datasets can be exported in various image formats, such as PNG, BMP, JPEG, PDF, or TIFF. The set can also be exported in complete data formats suited for post-processing purposes, such as RAW/SRM, FITS, VTK, VFF, and 32-bit floating-point TIFF.
Click to Enlarge
Figure 116V Despeckle Filter Applied to an OCT Image of a Human Tooth

Click to Enlarge
Figure 116U OCT Image of a Human Tooth
Analysis
ThorImageOCT includes several tools for convenient data analysis. The integrated marker tool measures distances, as well as the structure size. Additionally, this tool can be used to display the intensity profile of the OCT data across a line. For precise distance and thickness measurements, the refractive index of the material under investigation can be set.
Despeckle Filter
The Despeckle Filter is an optimized image filter to reduce speckle noise without blurring details of the imaged structure. It can be turned on and off for all acquired 2D images in the offline mode.
As shown in Figure 116V, the despeckle filter can be applied to an image to reduce speckle noise without blurring details of the imaged structure.
Click to Enlarge
Figure 116X The marker tool can be used to measure layer thickness.
Click to Enlarge
Figure 116W Surface Detection Tool
Marker Tool
The integrated marker tool serves to measures distances, as well as the structure size. Additionally, this tool can be used to display intensity profile of the OCT data across a line. For precise distance and thickness measurements, the refractive index of the material under investigation can be set.
Surface Detection
The Surface View performs a segmentation of the outer surface of the object viewed in the OCT section. The surface is then rendered with colors indicating the actual depth and can be filtered to reduce the effect of noise.
Feature Plugins
| Quick Links |
|---|
| Doppler Mode Speckle Variance Mode Polarization-Sensitive Modes Python User Interface for Processing |
Click to Enlarge
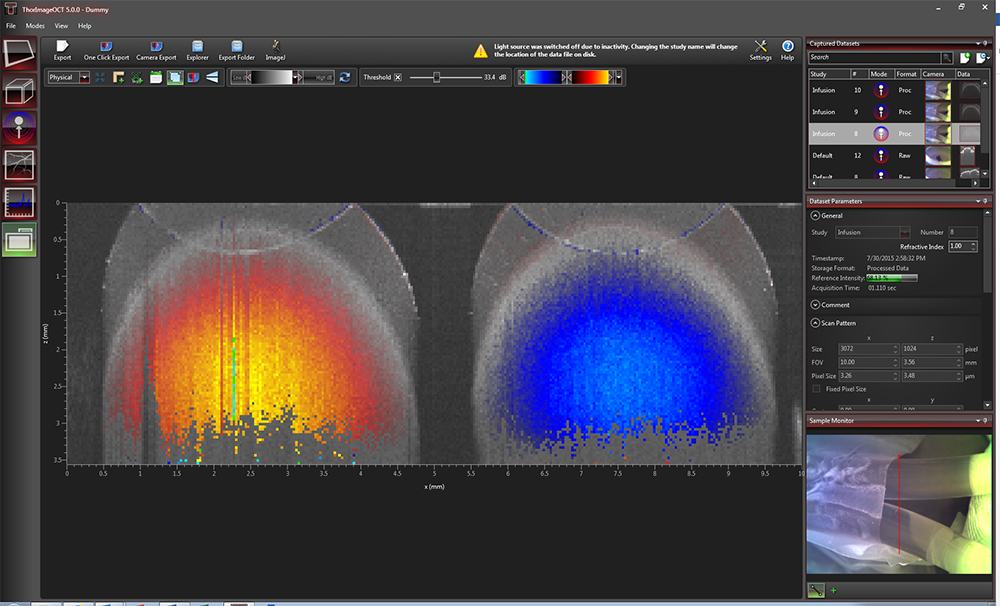
Figure 116Y Doppler Dataset Showing the Velocity of a Rotated Plastic Stick with Opposite Flow Directions.
Doppler Mode
Doppler OCT imaging comes standard with all OCT systems. In the Doppler mode, phase shifts between adjacent A-scans are averaged to calculate the Doppler frequency shift induced by particle motion or flow. The number of lateral and axial pixels can be modified to change velocity sensitivity and resolution during phase shift calculation. The Doppler images are displayed in the main window with a color map indicating forward- or backward-directed flow, relative to the OCT beam.
Click to Enlarge
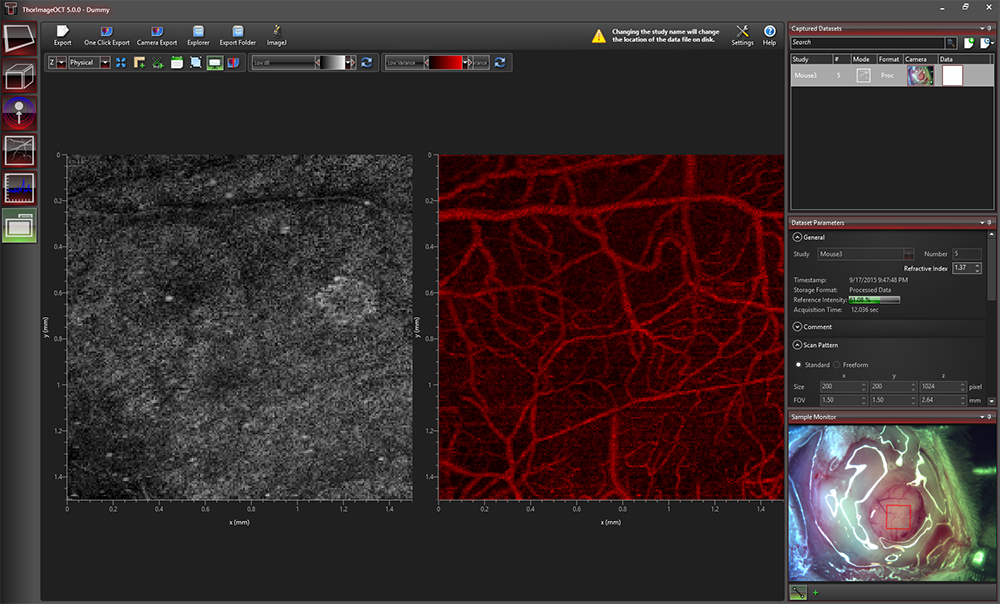
Figure 116Z Speckle Variance Measurement Showing Blood Vessels of a Mouse Brain.
Speckle Variance Mode
The speckle variance imaging mode is an acquisition mode that uses the variance of speckle noise to calculate angiographic images. It can be used to visualize three dimensional vessel trees without requiring significant blood flow and without requiring a specific acquisition speed window. The speckle variance data can be overlaid on top of intensity pictures providing morphological information. Different color maps can be used to display the multimodal pictures.
Polarization Sensitive
In the Polarization-Sensitive OCT (PS-OCT) system, two additional imaging modes are available, and the 1D mode is augmented to show each camera's spectra simultaneously. The combination of both cameras, and therefore the unique additional information of the PS-OCT system, is implemented in the 2D and 3D Polarization-Sensitive Imaging Modes.
Click to Enlarge
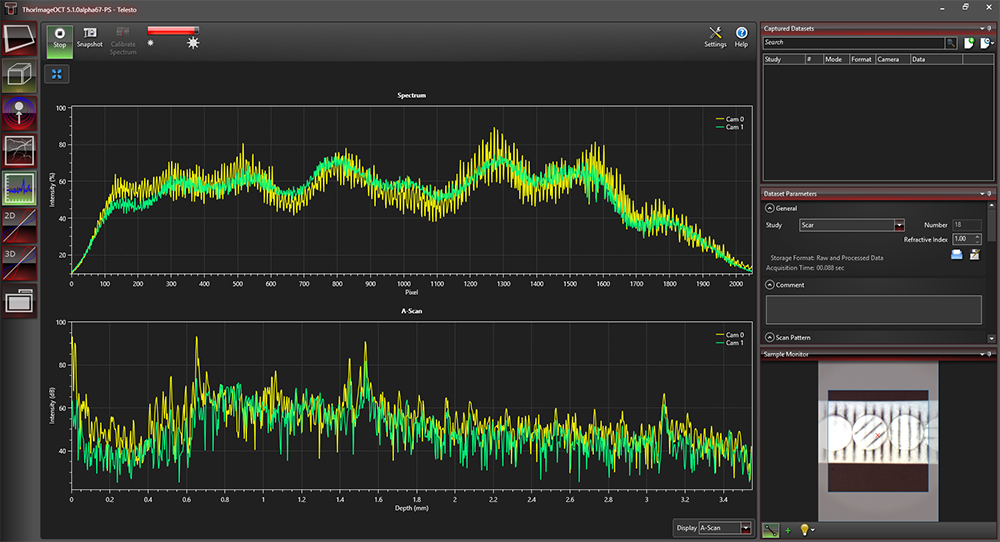
Figure 116AA Several A-Scans at a Single Point Over Time (M-Scan)
1D Mode
In this mode, single-point measurements can be made that provide spectral and depth information, as well as the ability to observe time-related sample behavior with an M-scan. For single-point measurements, the simultaneously acquired spectra of the two line scan cameras in the PS-OCT system are displayed separately.
Click to Enlarge
Figure 116AB Spectral and Depth Information for a Single Point (A-Scan)
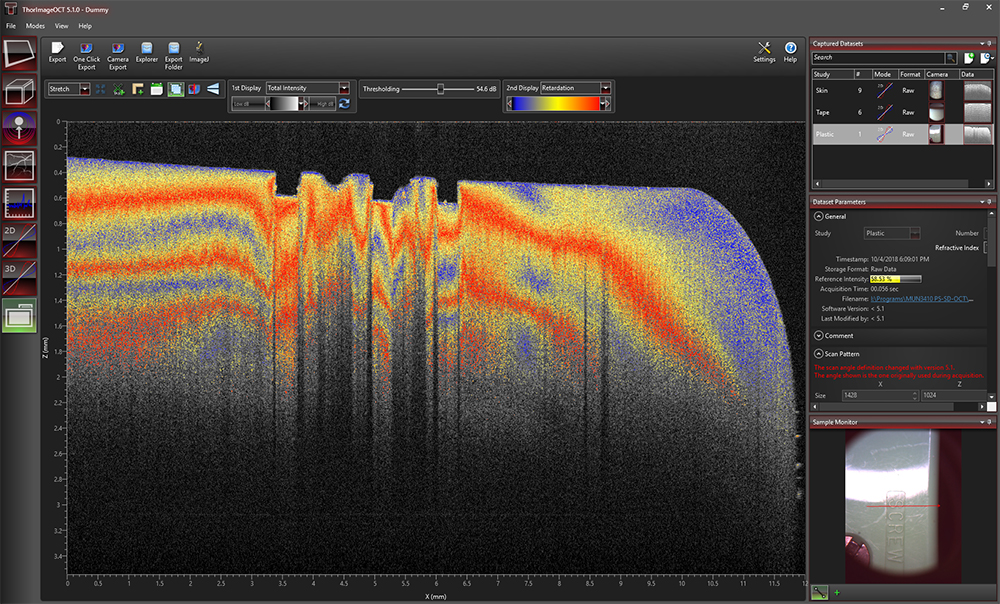
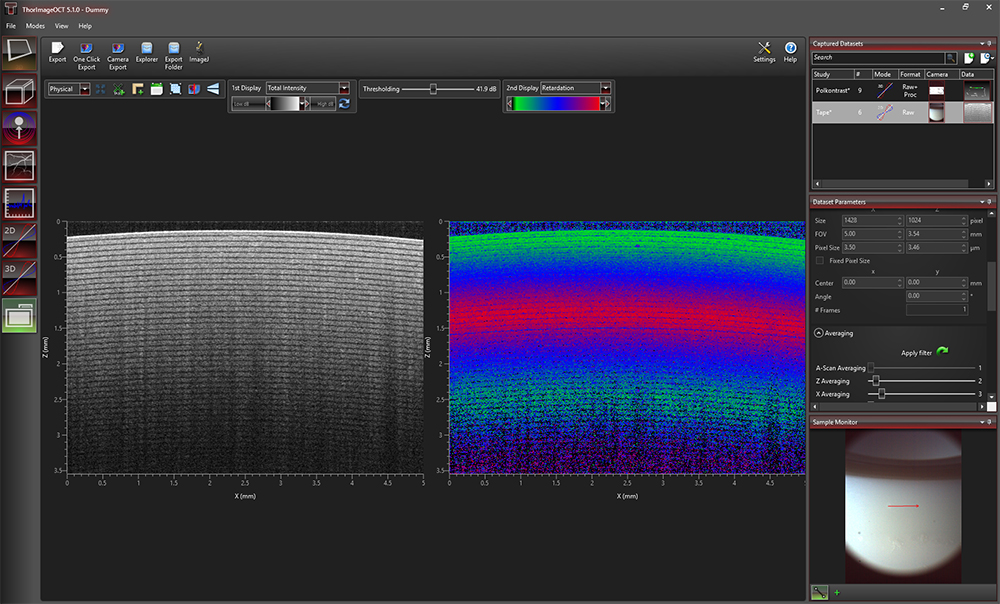
2D Polarization-Sensitive Mode
The 2D polarization-sensitive imaging mode acquires cross-sectional OCT images and displays them in real time. It has two configurable displays, each able to show one of the following images: a single camera's intensity, a combination of both cameras' intensities, or polarization data such as retardation, optic axis, DOPU or a single Stokes parameter. To improve the image quality or allow for variable acquisition time, several averaging parameters and adjustable line rates are implemented. Image display parameters, such as color mapping or thresholding, can be controlled in this mode. We have also implemented an option for automatic calculation of the optimum contrast, brightness, and thresholding of the displayed OCT images that operates on the intensity and PS-OCT images.
Click to Enlarge
Figure 116AC ThorImageOCT Window in 2D Polarization-Sensitive Mode
Click to Enlarge
Figure 116AD Dual Display Configuration of 2D Polarization-Sensitive Mode
Click to Enlarge
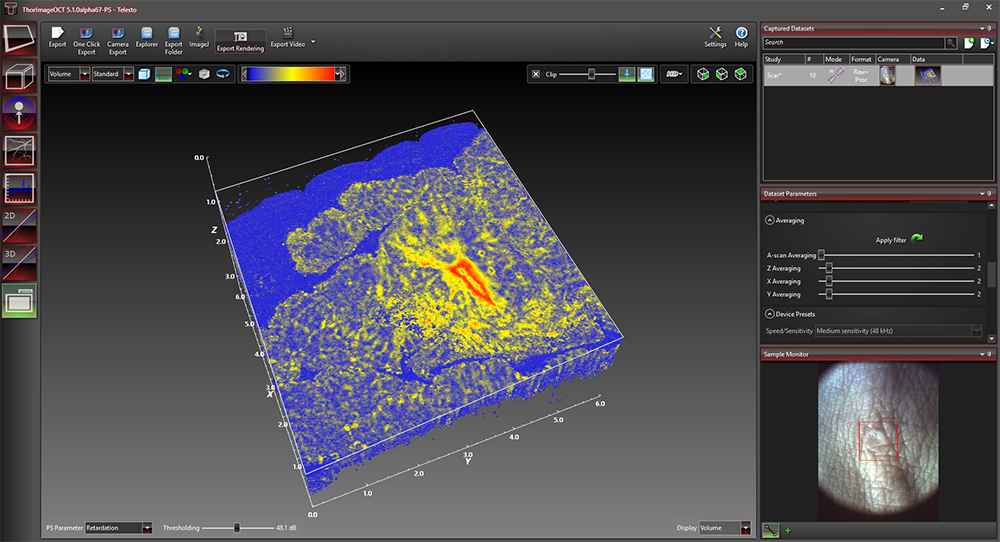
Figure 116AE The ThorImageOCT window in the 3D Polarization-Sensitive Mode
3D Polarization-Sensitive Mode
The 3D polarization-sensitive imaging mode extends the 3D imaging mode. The acquisition and display options are the same as in the 3D imaging mode. Additionally, the user can choose to display one of the following rendered volume imaging options: an intensity OCT image (from either a single camera or the combination of both) or a PS-OCT image (such as retardation, optic axis, DOPU or one of the three Stokes parameters). The rendered PS-OCT images can be adjusted with a threshold computed out of the intensity OCT image to only display the polarization-sensitive data of regions above the noise.
ThorImage OCT includes a Fast Volume Rendering mode, which provides a preview for high-resolution 3D acquisitions of intensity and PS-OCT images. In this mode, high-speed volume renderings can be displayed in real time, providing rapid visualization of samples in three dimensions.

Click to Enlarge
Figure 116AF Dataflow with Python Processing
Python User Interface for Processing
The Python Processing feature enables the advanced user to bypass the default signal processing routines and seamlessly integrate experimental/prototypical signal processing algorithms directly into the ThorImage environment. This provides utility both in the research (development of signal processing and analysis routines) and educational domains. Key features include:
- Write Customized Signal Processing Routines Using Python Syntax
- Utilize the Wide Array of Python Open-Source Signal Processing, Image Analysis, and Machine Learning Libraries
- Parameterize Algorithms and Routines
- Python Outputs and Debugging Messages Print Directly in ThorImage OCT
- Display Plots and Visualize Processing Steps with The Matplotlib Library
- Demo Implementations and Code Documentation Included
- Supports 1D, 2D, and 3D Imaging Modes of all Thorlabs OCT Systems (Excepting Doppler, Speckle Variance, and Polarization-Sensitive Imaging Modes)
Layer Thickness Measurement
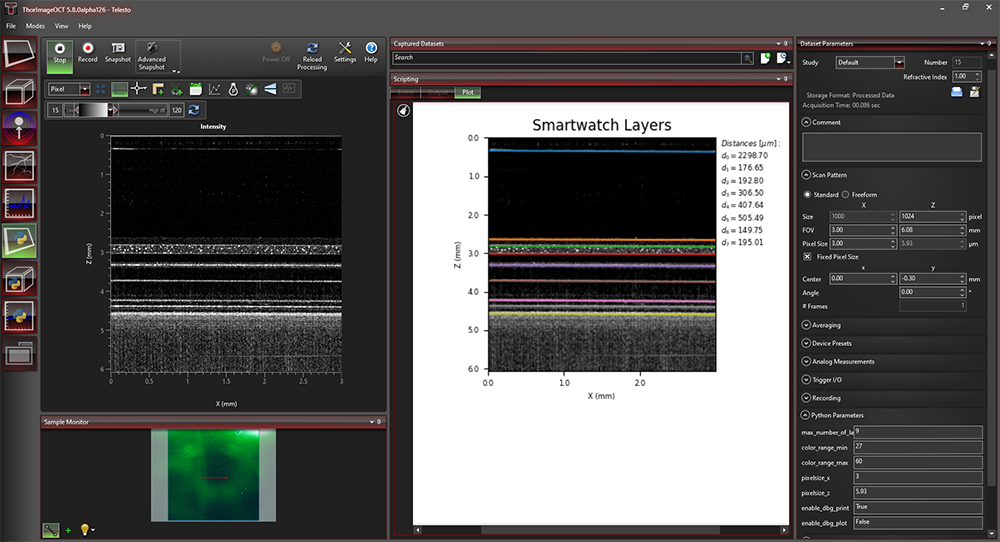
The Python Processing Interface also allows users to integrate customized post-processing algorithms for data modification or analysis. The demo program, shown in Figure 116AG, displays an OCT scan of the inner layers of a smart watch. By extending the signal processing algorithms with appropriate segmentation methods, the python processing feature can be used to highlight the individual layers and compute the distances in between.
Click to Enlarge
Figure 116AG Python Demo Program Post Processing Thickness Layer Measurement of a Smart Watch
Click to Enlarge
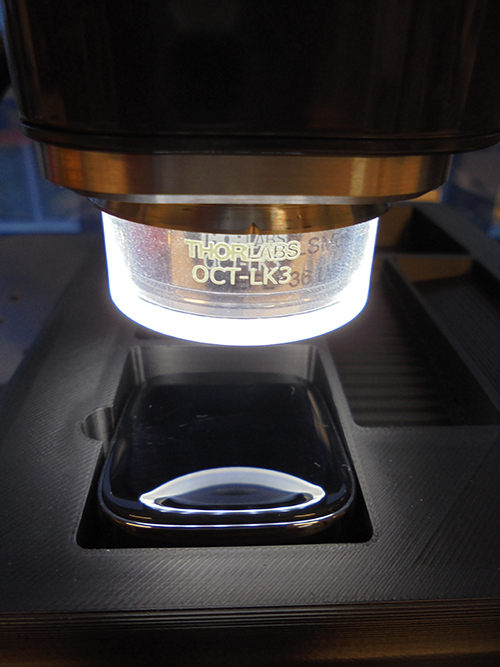
Figure 116AH Smartwatch Under OCTG13 with OCT-LK3
Integration
| Quick Links |
|---|
| Data Export Hardware Synchronization Third-Party Integration Software Development Kits Custom Programming Options User Guide |
Data Export
Datasets can be exported in various image formats, such as PNG, BMP, JPEG, PDF, or TIFF. The set can also be exported in complete data formats suited for post-processing purposes, such as RAW/SRM, FITS, VTK, VFF, and 32-bit floating-point TIFF.
The OCT file format native to ThorImageOCT allows OCT data, sample monitor data, and all relevant metadata to be stored in a single file. ThorImageOCT can also be installed and run on computers without OCT devices in order to view and export OCT data. The user has full access to the raw and processed data from the device, including additional data used for processing, e.g. offset errors.
Click to Enlarge
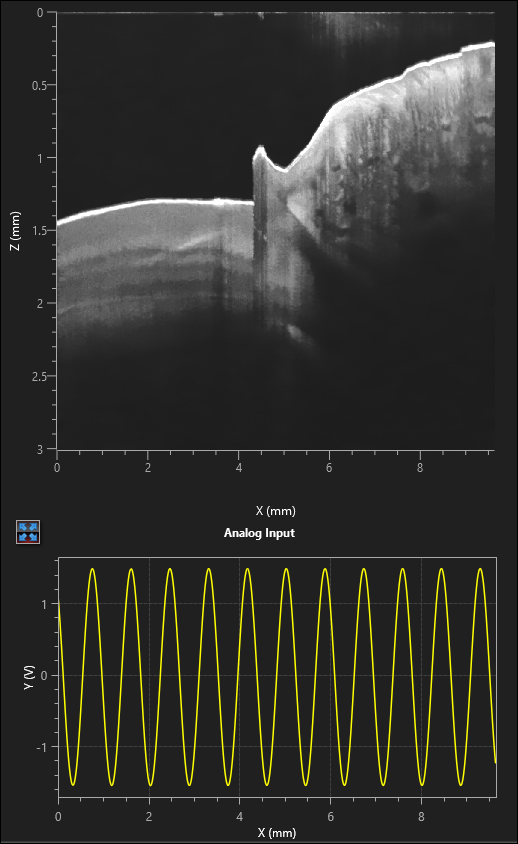
Figure 116AJ Analog Data Visualization in the 2D Display
Hardware Synchronization
Externally-Triggered Acquisition
ThorImageOCT and the SDK APIs (in C, LabVIEW, and Python) provide the ability to externally trigger the acquisition of A-Scans. This enables the user to synchronize measurements from different modalities (e.g. vibrometry and synchronized positioning) with an OCT measurement. Synchronization is greatly simplified with all current CameraLink-based Thorlabs OCT systems (a TTL level trigger signal source is required). External triggering is available for all imaging modes and can be toggled in the settings dialog in ThorImageOCT.
Thorlabs' current generation of Ganymede and Telesto SD-OCT, and the Telesto PS-OCT Systems include an external B-Scan trigger for synchronization with other experiments.
Analog Input for Synchronization with Other Modalities
Thorlabs' current generation of Ganymede and Telesto SD-OCT, and the Telesto PS-OCT Systems include two analog input channels, which can be used to combine imaging modalities. The analog signal from another data source (i.e., fluorescence signal) is sampled and displayed simultaneously with the OCT signal.
Third-Party Integration

Click to Enlarge
Figure 116AK Export buttons are accessible in the Action Toolbar of ThorImageOCT.
Link to ImageJ
If both ImageJ and ThorImageOCT are installed on the computer, opening acquired OCT data in ImageJ is one mouse click away. This enables a smooth workflow when requiring the advanced image processing functionality provided by ImageJ. Clicking the Explorer button will open the folder and select the file in Windows Explorer where the currently active dataset is stored.
External Program
Click to Enlarge
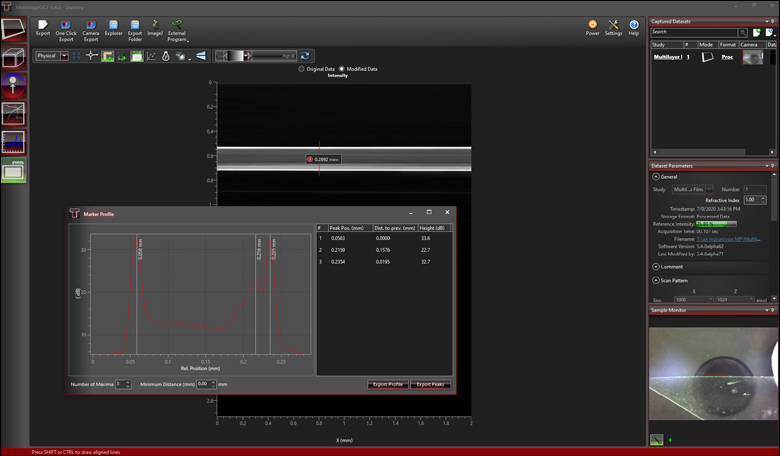
Figure 116AN After smoothing the data in ImageJ, the marker tool in ThorImageOCT can be used to measure layer thickness.
Click to Enlarge
Figure 116AM A filter for smoothing lateral directions is applied to the image in ImageJ.
Click to Enlarge
Figure 116AL OCT Data of a Plastic Multilayered Film with Speckle
Acquired OCT datasets can also be exported and modified in a third-party program, and then reimported back into the ThorImageOCT software. This functionality allows fast and customized modifications of OCT images, while still using the dataset management of the ThorImageOCT software. As shown in Figures 116AL, 116AM, and 116AN, OCT data (Figure 116AL) can be exported to ImageJ and a smoothing filter applied in the lateral direction (Figure 116AM). Using the "External Program" button allows the modified data to be reimported into ThorImageOCT for further analysis. For example, the peak detection tool can be used to measure the layer thicknesses (Figure 116AN).
Python User Interface for Processing
The Python User Interface for Processing described in the Feature Plugins tab above enables user-development of customized processing routines, and allows for live display of these processing routines.

Click to Enlarge
Figure 116AP Available ThorImage Automation Functions Marked in Red from ThorImageOCT GUI in the 2D Acquisition Mode
Software Development Kits
Spectral Radar APIs
For maximum flexibility, customized solutions can be implemented in ThorImageOCT using software development kits (SDKs). Experienced software developers can use these in a multitude of programming environments to tailor the use of Thorlabs OCT systems to their specific application. SDKs are available in:
- ANSI C
- LabVIEW®
- Python
ThorImage Automation
ThorImage Automation is a light-weight API for performing OCT tasks through the ThorImageOCT GUI. This is in contrast to the SpectralRadar API, which communicates directly with the device. SpectralRadar offers large flexibility, whereas ThorImage Automation enables implementation of simple OCT task with a minimal amount of code.
ThorImage Automation is available in:
- C
- C#
- LabVIEW
- Python
Custom Programming Options User Guide
Table 116AQ provides guidance on choosing the right programming option for the user depending on the user requirements, programming experience and capabilities of the software.
| Table 116AQ ThorImage®OCT Programming Options User Guide | |||||
|---|---|---|---|---|---|
| SDK APIs | ThorImage Automation | Python Processing | External Program | ||
| Entry Point | User Program | User Program | ThorImageOCT GUI | ThorImageOCT GUI | |
| Flexibility/Limitation | Great Flexibility | Limited to Specific ThorImageOCT GUI Functionality | Limited to OCT Processing Functionality | Limited to OCT Post Processing Functionality | |
| Programming Level | Low Level | High Level with Very Little Code | Low Level (OCT Processing Only) |
Low-Medium Level (Post Processing Only) |
|
| Online/Offline | Full Control on User Side |
Online (Hook to Specific ThorImageOCT GUI Functions to the Code) |
Online (User Processing Code Used in ThorImageOCT GUI) |
Offline (Feature in ThorImageOCT GUI) |
|
| ThorImageOCT Running/Usable At the Same Time | No | Yes | Yes | Yes | |
| Software | C | Yes | Yes | No | Arbitrary Third-Party Software |
| C# | Via C-API | Yes | No | Arbitrary Third-Party Software | |
| LabVIEW | Yes | Yes | No | Arbitrary Third-Party Software | |
| Python | Yes | Yes | Yes | Arbitrary Third-Party Software | |
| Example User REquirements: Implementation of ... | User GUI | Yes | No | No | No |
| User OCT Processing | Yes | No | Yes | No | |
| User Post Processing | Yes | No | No | Yes | |
| Automation | Yes | Yes | No | No | |
| Recommended OCT Knowledge | Advanced | Beginner | Beginner | Beginner | |
| Rocommended OCT Processing Knowledge | Beginner | Beginner | Advanced | Beginner | |
Specifications
| ThorImage®OCT Specifications | ||
|---|---|---|
| General | Compatibility | |
| OCT Method |
|
|
| Imaging Modes |
|
|
| Operating System |
|
|
| Acquisition | Synchronization Options |
|
| Sample Monitor |
|
|
| Data Acquisition |
|
|
| Speed/Sensitivity |
|
|
| Scan Control |
|
|
| Averaging |
|
|
| Apodization |
|
|
| Probe Calibration |
|
|
| Processing | GUI |
|
| Python Processing Interface |
|
|
| Data Viewing | Common Options |
|
| 2D Mode |
|
|
| 3D Mode |
|
|
| Analysis | Native Tools |
|
| Third-Party Integration |
|
|
| File Handling | .oct Files | Full Access To:
|
| File Export |
|
|
| SDKs | Spectral Radar API |
|
| ThorImageAutomation |
|
|
| Settings | Workspace |
|
| Support | Technical Support |
|
For information on the availability of ThorImageOCT version 5.8, please contact our OCT Support Team.
| Posted Comments: | |
Soojung Kim
(posted 2024-12-21 13:36:17.687) Hi. I
have a question about exporting after scanning in three-dimensional mode.
When I export to text and CSV files, I get an array of numbers. I want to know the meaning of the rows, columns, and numbers.
Is it possible to represent these numbers in a three-dimensional graph?
Best regards, Ciara D.
(posted 2024-04-20 17:30:02.08) Hi. Our lab owns a TEL220C1 OCT System and, similar to Soojung Kim, when the system is turned on, the computer recognizes the connection to the system. However, when I open the ThorImage OCT software it says, "No OCT device found. Entering offline mode."
We've not had this problem before, and we've been using the system with this particular computer and software for a long time. The system was last used approximately 4 weeks ago with no problems. Do you know how this issue could be fixed?
Thank you in advance for your help. Soojung Kim
(posted 2024-02-02 10:37:19.853) Hello.
I purchased Thorlabs CAL110C1 (OCT system).
I installed the software (ThorImageOCT 5.2.1) on a new computer because I had to connect it to it. The system was powered on and connected to the computer via USB, but the software did not recognize it.
The computer recognizes that it is connected to USB, but when the software is turned on, it appears that the OCT equipment is not recognized.
I used it well on an existing computer without any problems, but is there anything I need to go through when installing it on another computer?
Thank you. GBoedecker
(posted 2024-02-02 06:13:54.0) Thank you for your feedback. We will contact you directly to find a solution for your current problem. user
(posted 2022-07-07 18:22:53.783) i got the software(Thorimage OCT 4.4).
but if i use the software, that shout down.
i don't know what is problem.
i want to only view my data.
so, can i get the software only viewer mode? |