 Products Home / Optogenetics / Optogenetics Patch Cables / Low-Autofluorescence Multimode Patch Cables
Low-Autofluorescence Multimode Patch Cables

- Low-Autofluorescence for Fiber Photometry Applications
- Ø200 or Ø400 µm Core, 0.50 NA Multimode Fiber
- Stainless Steel Ferrules
- Custom Patch Cables Options Available
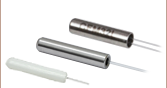
MAF1L1
Patch Cable
Ø400 µm Core
with FC/PC Connectors
MAF2L1
Patch Cable
Ø400 µm Core
with FC/PC Connector
and Ø1.25 mm Ferrule
MAF4L1
Patch Cable
Ø200 µm Core
with FC/PC Connectors
MAF6L1
Patch Cable
Ø200 µm Core
with FC/PC Connector
and Ø2.5 mm Ferrule


Please Wait
Click to Enlarge
Click Here for Raw Data
Plot comparing the recovery of autofluorescence for a low-autofluorescence (AF) and standard patch cable after photobleaching at 470 nm for 12 hours. A previous-generation M470F3 LED was used for excitation and autofluorescence intensity at 525 nm was measured relative to the output power from the patch cable.
Features
- Low-Autofluorescence* (AF) Multimode Fiber Patch Cables:
- Ø200 µm or Ø400 µm Core
- 0.50 NA
- Use in Fiber Photometry Applications with GFP (470 nm Excitation) and RFP (565 nm Excitation)
- Operating Wavelength Range* (Click For Plot): 300 - 1200 nm
- Connector Options:
- 2.0 mm Narrow Key FC/PC Connector, Ø1.25 mm (LC) Ferrule, or Ø2.5 mm (FC) Ferrule on Specimen Side
- 2.0 mm Narrow Key FC/PC Connector on Non-Specimen Side
- Black Jacketing Minimizes Light Leakage
- 1 m Cable Length
- Contact Tech Sales with Custom Patch Cable Requests
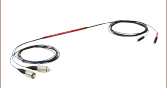
These multimode patch cables are manufactured with components that reduce the emitted autofluorescence in the visible spectrum. This makes these patch cables suitable for fiber photometry applications where high sensitivity is required to measure the changes in fluorescence that indicate neural activity within a specimen. The design of these patch cables is based on testing of the autofluorescent properties of our patch cable components such as the bare fiber, ferrule types, and epoxies.
Each patch cable incorporates a Ø200 µm or Ø400 µm core, 0.50 NA multimode fiber (Item # FP200URT and FP400URT, respectively) and is available with one of three connector configurations. One end is equipped with an FC/PC connector with a 2.0 mm narrow key, while the other is equipped with a 2.0 mm narrow key FC/PC connector, Ø1.25 mm stainless steel ferrule, or a Ø2.5 mm stainless steel ferrule. Similar to our standard optogenetics patch cables, the patch cables with a ferrule end can be mated to a fiber optic cannula using an interconnect or mating sleeve; see the selection guide below for compatible products.
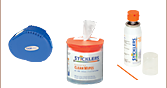
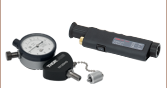
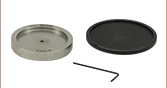
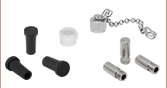
Each patch cable includes two protective caps that shield the ferrule ends from dust and other hazards when not in use. Additional plastic, metal, or threaded caps for the connector and ferrule ends are sold separately here. If the fiber ends become dirty from use, we offer a selection of inspection tools, as well as fiber optic cleaning products.
Photobleaching
For optimal performance during your experiment, low-autofluorescence patch cables should undergo a photobleaching procedure prior to use. This process saturates the fluorophores in the fiber and patch cable components, which minimizes autofluorescent emissions. Because the autofluorescence will eventually recover to a steady state value after photobleaching (as seen in the graph to the right), this process should be repeated each time the cable will be used in an experiment. Please see the Photobleaching tab for additional information on the needed equipment and procedure.
In our product testing, we compared the autofluorescence recovery of a low-autofluorescent patch cable to a standard patch cable. The graph to the right shows the measured autofluorescence relative to the output power for each test patch cable over a period of 36 days. We observe that the low-autofluorescent patch cable has a lower autofluorescence ratio immediately after photobleaching and also exhibits a slower recovery of autofluorescence over the test period.
Mating Sleeve and Patch Cable Compatibility
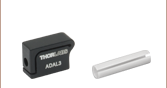
The ferrule diameter of a patch cable and cannula is the key factor for physical compatibility with an interconnect and mating sleeve. Cannulae and patch cables using Ø1.25 mm (LC) ferrules can be connected using the ADAL1 mating sleeve or ADAL3 interconnect. Patch cables and cannulae using Ø2.5 mm (FC) ferrules are compatible with the ADAF1 mating sleeve and ADAF2 interconnect.
*Low-autofluorescence was tested and verified for excitation at 470 nm and 565 nm. Performance may vary for excitation at other wavelengths. These patch cables can transmit light over the specified wavelength range of 300 - 1200 nm.
| Related Fiber Photometry and Optogenetics Products | ||||
|---|---|---|---|---|
| Light Sources | Patch Cables (Ø200 µm or Ø400 µm Core) | Mating | Cannulae | Accessories |
| Fiber-Coupled LEDs MM Laser, 473 nm |
Standard (Ø200 µm Core and Ø400 µm Core) Rotary Joint Low-Autofluorescence |
Interconnects Mating Sleeves |
Standard (Ø200 µm Core and Ø400 µm Core) | Implant Guides Cannula Holders |
Click to Enlarge
Example Photobleaching Procedure
Fiber photometry experiments measure fluorescence emitted from genetically-modified cells as an indicator of neural activity. To obtain the sensitivity needed for resolving the small changes in fluorescence emissions, noise from other sources, such as the optical patch cables, must be minimized. The most common fluorophore used in fiber photometry is green fluorescent protein (GFP) which is excited at wavelengths near 470 nm.
Photobleaching is a process where the fluorophores in a sample or material are saturated with light at the excitation wavelength. This makes it a useful technique for reducing the emitted autofluorescence in a patch cable prior to a fiber photometry experiment. We recommend that users photobleach their patch cables before each experiment. The steps below detail a general procedure that can be used.
- Choose a fiber-coupled LED with a wavelength that matches your experiment and that has adequate output power.
- Connect the low-fluorescent patch cable to the LED and cover the fiber output to reduce the amount of stray light exiting the fiber.
- Set the LED output power to its maximum value.
- Allow the patch cable to be continuously exposed for at least 8 hours; time required may vary depending on the wavelength and output power of the LED.
Test Setup for Autofluorescence Measurement
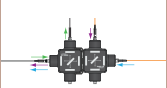
In our performance testing, Thorlabs measured the emitted autofluorescence from these patch cables at an excitation wavelength of 470 nm. The experimental setup used is shown in the diagram below; click on the link below the diagram for a list of parts for excitation at 470 nm and measuring autofluorescence at 525 nm.
Click to Enlarge Schematic of autofluorescence measurement setup for 470 nm excitation. This setup used our previous-generation M470F3 fiber-coupled LED.
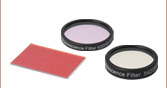
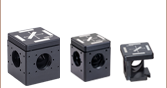
In this setup, a DFM1 dichroic filter cube is fitted with fiber collimators and imaging filters to direct light to and from the low-autofluorescence patch cable. Excitation light from the fiber-coupled LED is directed by the dichroic cube to the low-autofluorescence patch cable, which is left uncapped and open to air. Autofluorescent emissions at 525 nm in the patch cable are coupled through the fiber and dichroic filter to the S130C detector.
Using this setup, we measured the autofluorescence relative to the output power during the photobleaching process (graph below and to the left) and as the autofluorescence recovers after photobleaching (graph below and to the right). We observe that overnight exposure (>8 hours) greatly reduces the autofluorescence of the patch cable and that the recovery of a low-autofluorescence patch cable is slower than a standard patch cable.
Click to Enlarge
Click Here for Raw Data
Plot comparing the recovery of autofluorescence for a low-autofluorescence (AF) and standard patch cable after photobleaching at 470 nm for 12 hours. Autofluorescence intensity at 525 nm was measured relative to the output power from the patch cable. The test setup for measurement is shown to the right.
Click to Enlarge
Click Here for Raw Data
Plot of autofluorescence ratio (measured at 525 nm) versus photobleaching time at 470 nm. Autofluorescence intensity at 525 nm was measured relative to the output power from the patch cable. The test setup for photobleaching and measurement is shown to the right.
| Posted Comments: | |
user
(posted 2020-10-06 07:06:01.357) Hi,
I am writing to ask a clarification regarding the low-autofluorescence fibers and a product request.
a. Regarding autofluorescence: Is this aspect different from solarization? What I mean is that once you "photobleach" the fiber, you are inducing solarization to the fiber, so the light power emmited is reduced, so I assume also the recorded fluoresence in the photoreceiver. Have you controlled for this aspect in these quantifications?
b. Beyond using the FP400URT fiber, which other aspects have been improved to make this construct "low-autofluorescence"?
c. Do you have a 200um version of the fiber available?
Thank you in advance.
Kind regards. YLohia
(posted 2020-10-09 04:52:52.0) Hello, thank you for contacting Thorlabs. A) Solarization refers to the formation of color centers within a fiber that lead to transmission degradation. These color centers form when exposed to light below 300 nm. Since we photobleach at 470nm, it won’t cause photodarkening. The fiber transmission will not drop due to photobleach.
B) Other than the FP400URT fiber, we also use low-fluorescence epoxy and a stainless steel ferrule.
C) Custom fiber patch cables can be requested by emailing techsupport@thorlabs.com or by clicking on the "Request Quote" button above. We will discuss the feasibility of offering this directly. Emmanuel Labrada
(posted 2019-10-21 14:07:59.413) Hi, we just got one of those to replace a broken cable and it's excellent, however we may need one longer, about 2 m long, probably we are ordering a custom one (actually a quote would be great), but would be better to have the option to just put it into the car.
Thank you!
Emmanuel YLohia
(posted 2019-10-21 04:16:46.0) Hello Emmanuel, thank you for your feedback. We are happy to hear that our Low-Autofluorescence Multimode Patch Cables are working well in your setup. Custom item quotes can be requested by emailing techsupport@thorlabs.com. I have reached out to you directly regarding your request. |
| Item # | Fiber Type |
Wavelength Rangea |
Core Diametera |
Cladding Diametera |
Coating Diametera |
Numerical Aperturea |
Max Core Offseta |
Minimum Bend Radiusa (Short Term / Long Term) |
Connectors | Jacket |
|---|---|---|---|---|---|---|---|---|---|---|
| MAF4L1 | FP200URT | 300 - 1200 nmb | 200 ± 5 µm | 225 ± 5 µm | 500 ± 30 µm | 0.50 | 5 µm | 21 mm / 42 mm | FC/PC to FC/PC |
Ø3 mm Black PVC Furcation Tubing |
| MAF5L1 | FC/PC to Ø1.25 mm Ferrule |
Ø1/16" Heatshrink Tubing |
||||||||
| MAF6L1 | FC/PC to Ø2.5 mm Ferrule |
Ø2 mm Black PVC Furcation Tubing |
| Item # | Fiber Type |
Wavelength Rangea |
Core Diametera |
Cladding Diametera |
Coating Diametera |
Numerical Aperturea |
Max Core Offseta |
Minimum Bend Radiusa (Short Term / Long Term) |
Connectors | Jacket |
|---|---|---|---|---|---|---|---|---|---|---|
| MAF1L1 | FP400URT | 300 - 1200 nmb | 400 ± 8 µm | 425 ± 10 µm | 730 ± 30 µm | 0.50 | 7 µm | 43 mm / 86 mm | FC/PC to FC/PC |
Ø3 mm Black PVC Furcation Tubing |
| MAF2L1 | FC/PC to Ø1.25 mm Ferrule |
Ø1/16" Heatshrink Tubing |
||||||||
| MAF3L1 | FC/PC to Ø2.5 mm Ferrule |
Ø2 mm Black PVC Furcation Tubing |